Bild-Suite
Studio
Bildsuche
Suchen
Kategorien
Hilfe
Auf Pro upgraden
Registrieren
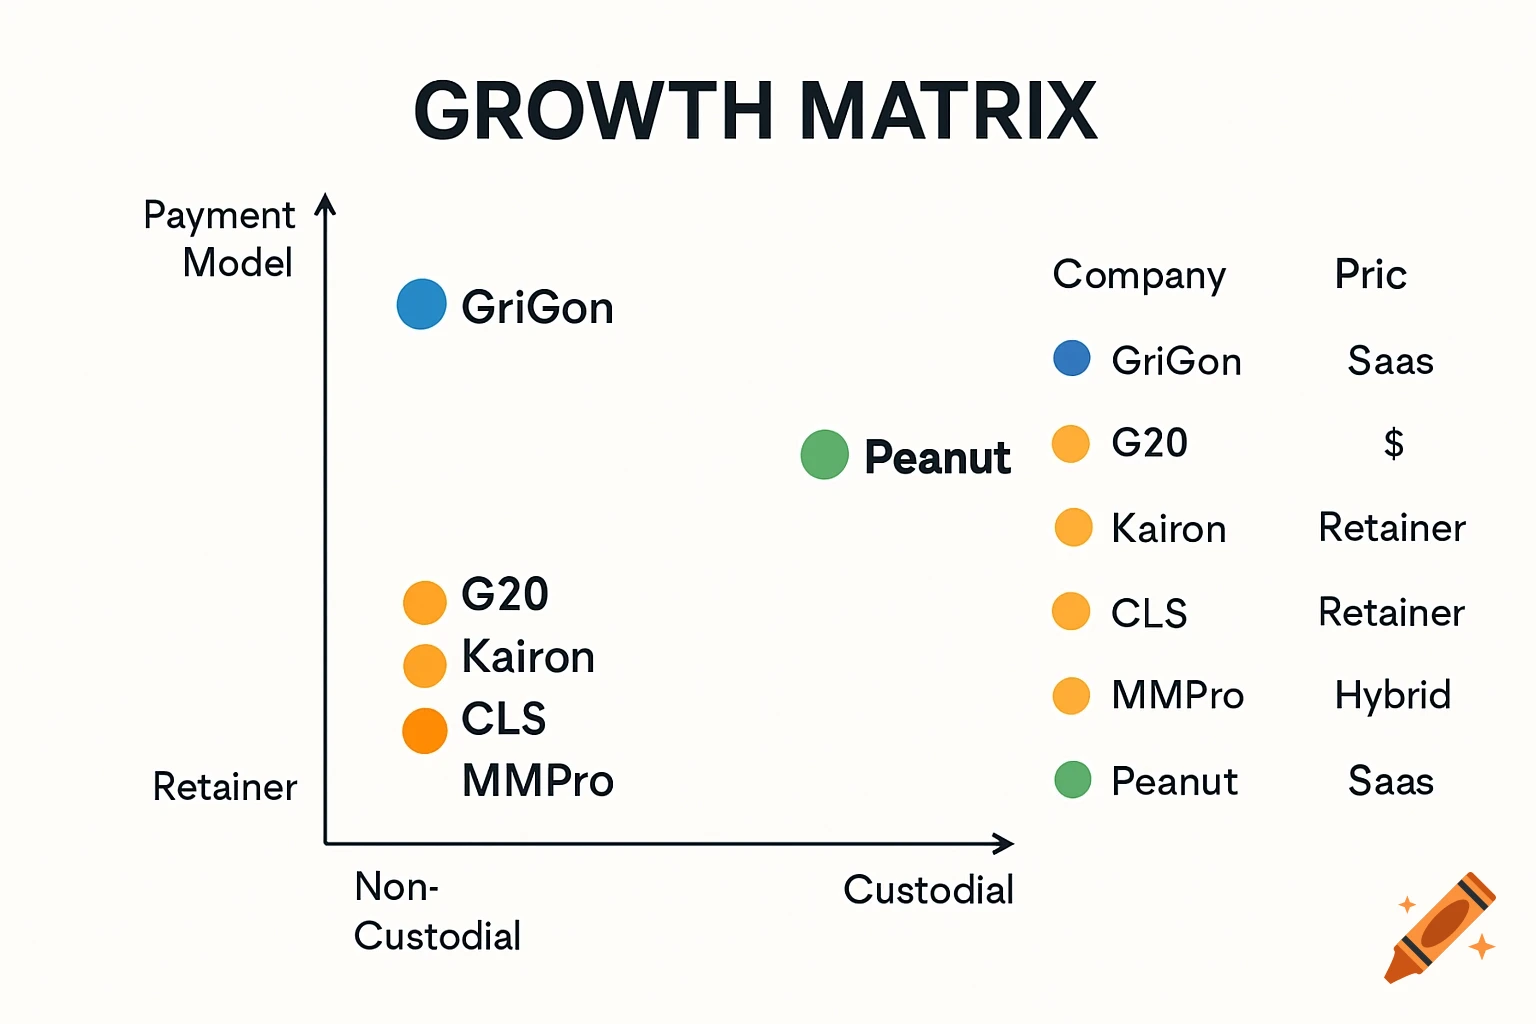
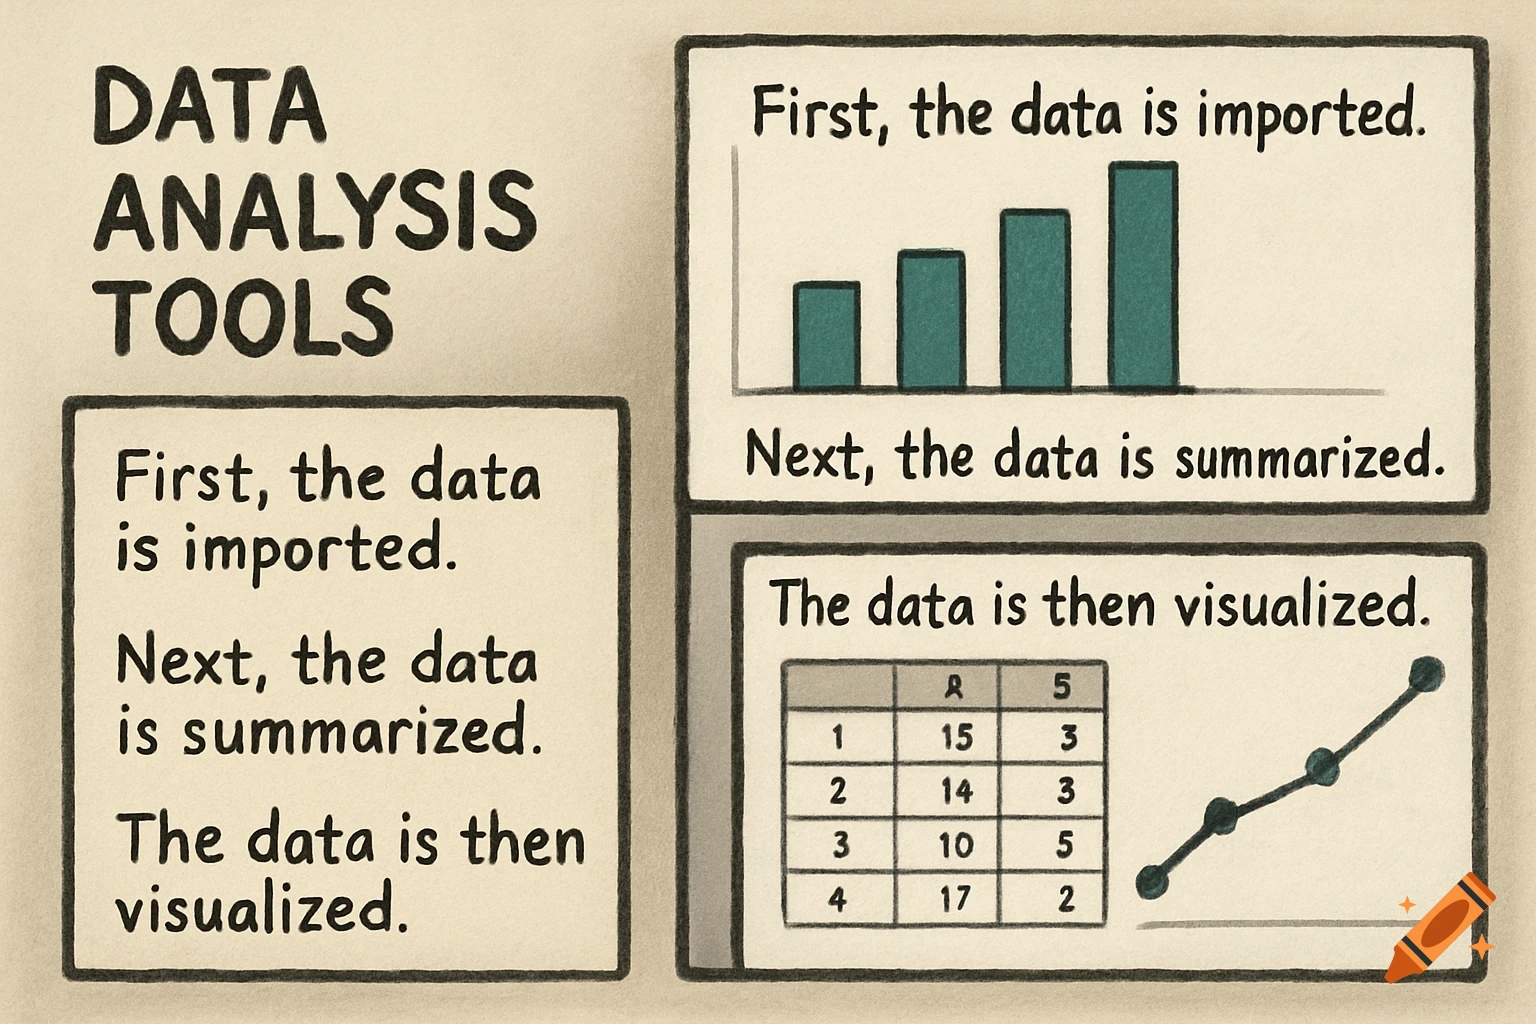
Diagram
Bilder erkunden
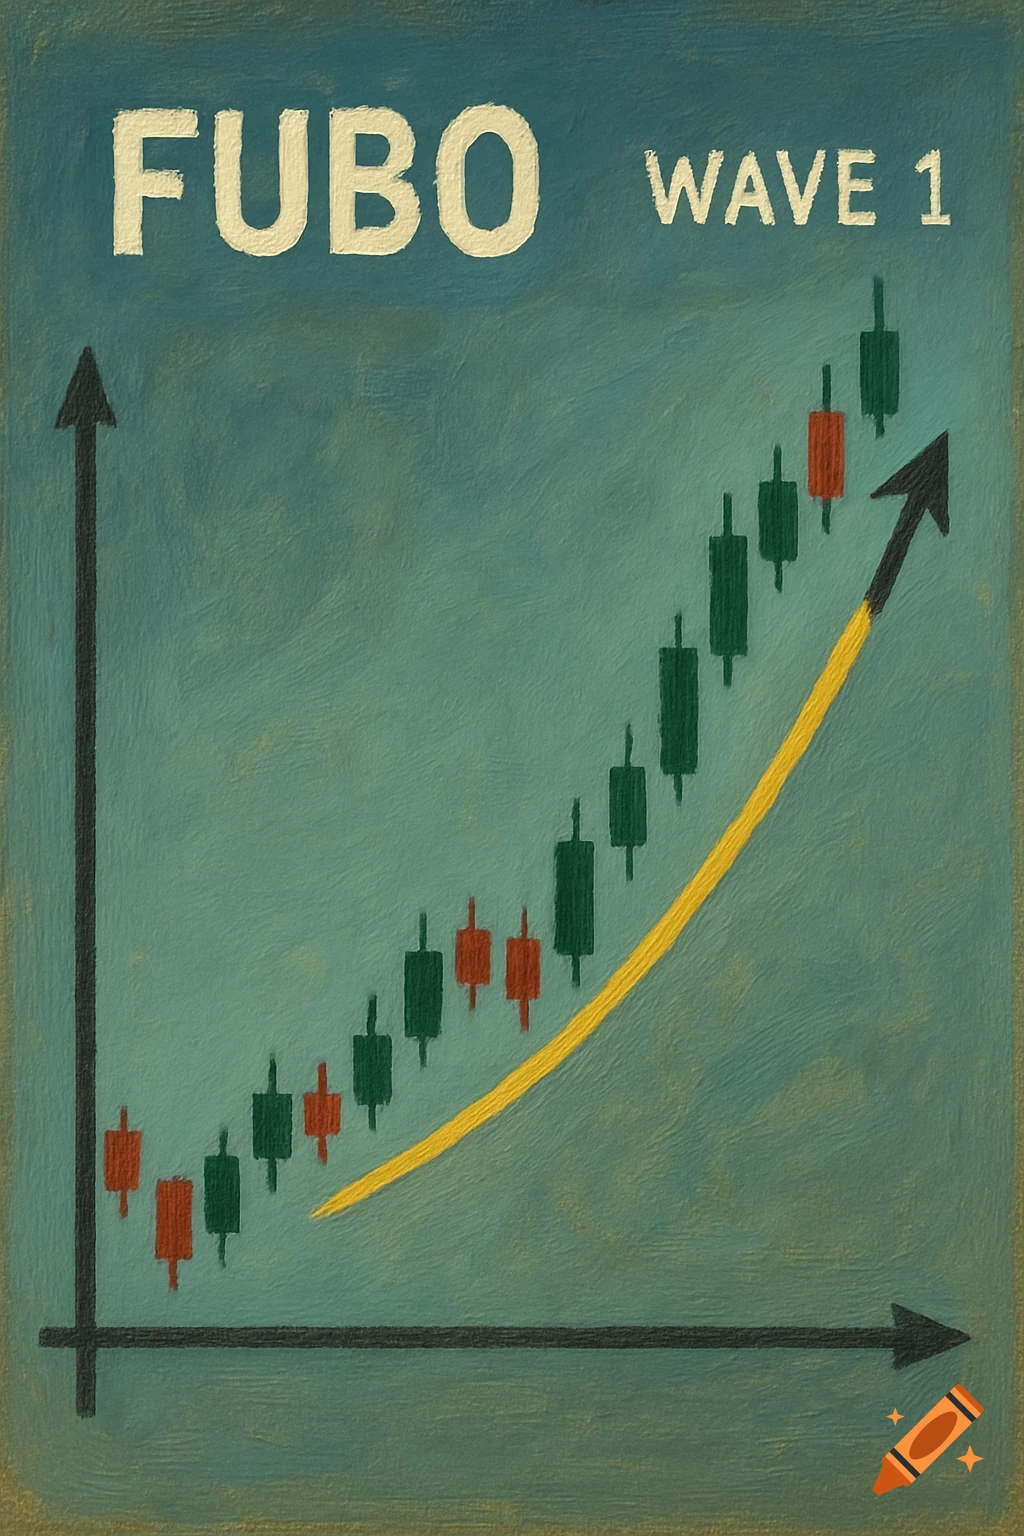
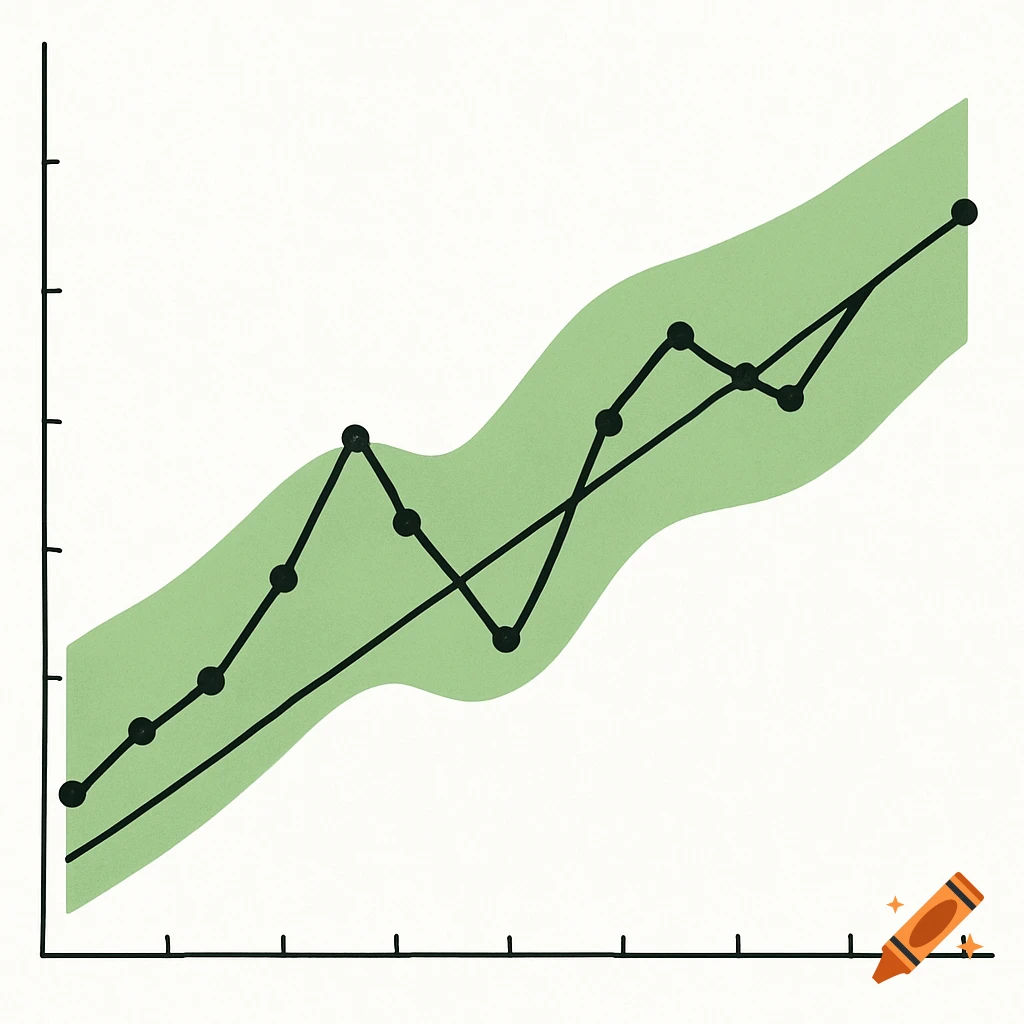
Chart
Graphs
Mehr zeichnen
Retuschieren


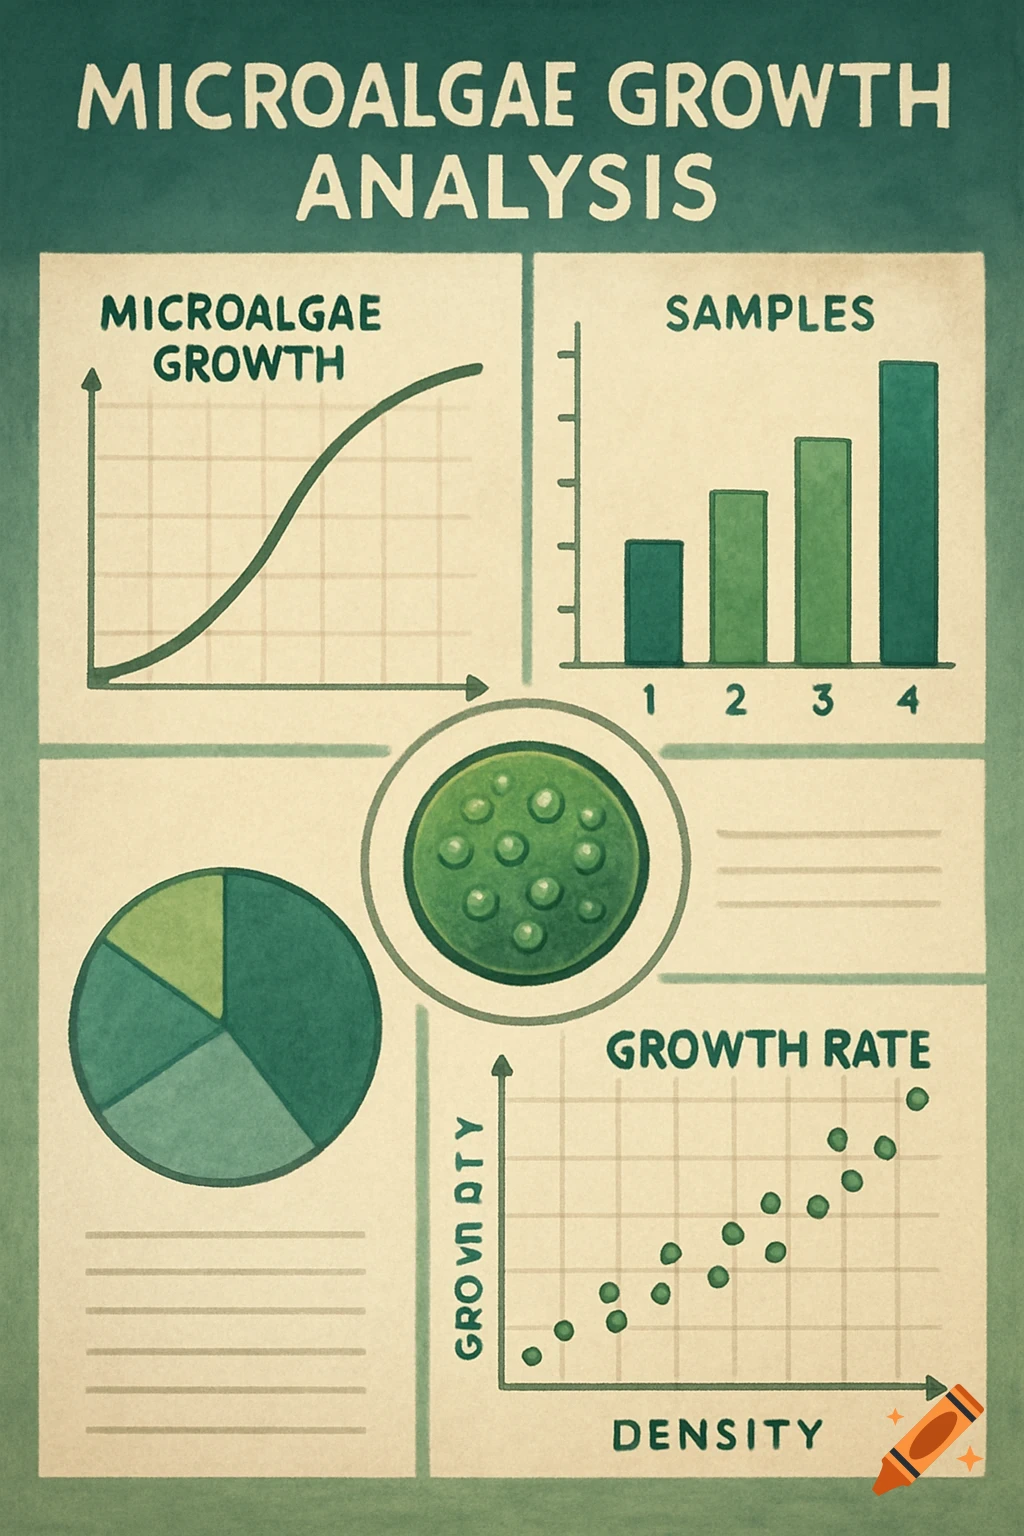
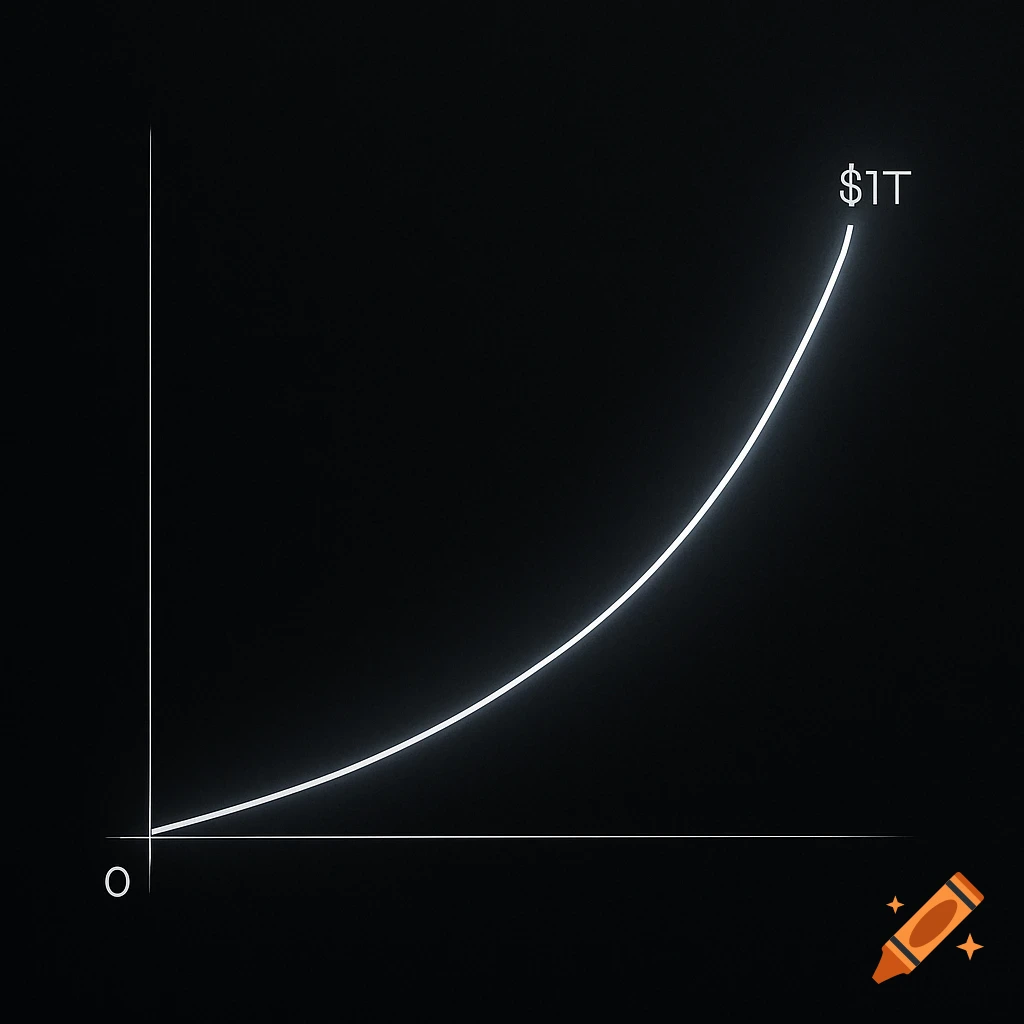
![A 2D graph displaying a sigmoidal curve, showing pH on the y-axis and time [s] on the x-axis, on a dark background.](https://media.craiyon.com/2026-04-27/wY4W5l_9RY6KUeZB5ik_Aw.webp)