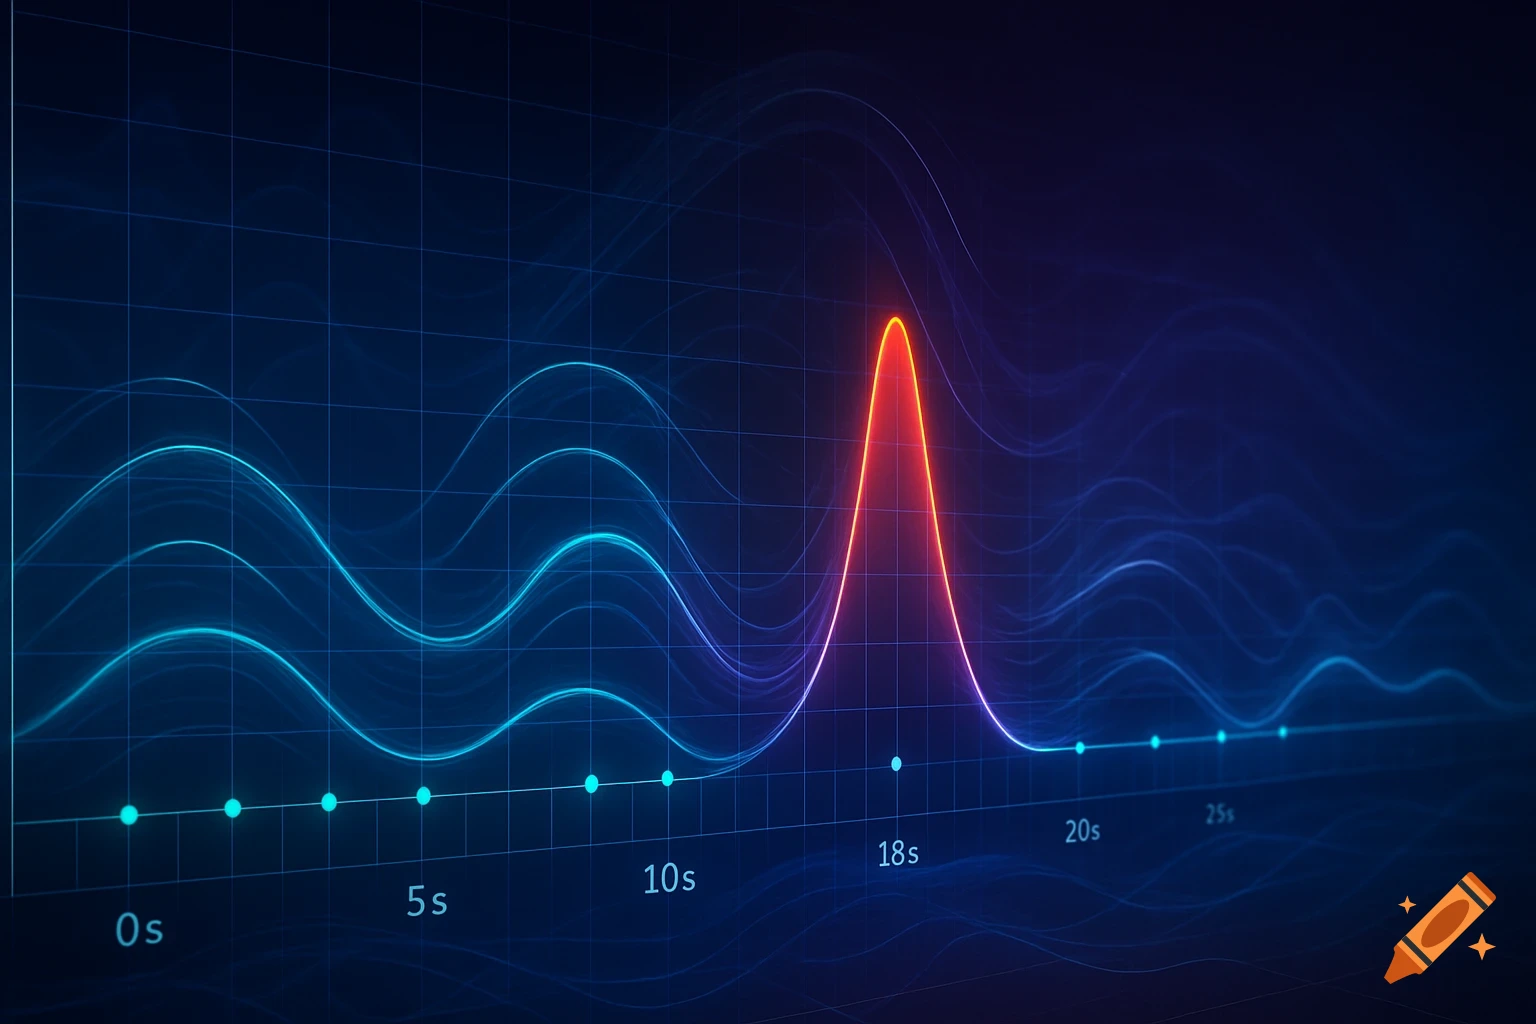
A glowing line graph on a dark blue background shows Super E5 fuel and Brent oil prices from 2016 to 2026, with annotations for economic and geopolitical events.

Mach das hier zu einen lienien Diagramm: Jahr Super E5 (€/Liter) Rohöl Brent ($/Barrel) Ereignis / Kontext 2016 1,30 45,13 Überangebot am Markt 2017 1,37 54,75 Wirtschaftliche Erholung 2018 1,46 71,34 US-Sanktionen gegen Iran 2019 1,43 64,30 Stabiles Angebot 2020 1,29 43,21 Corona-Pandemie (Lockdowns) 2021 1,58 70,86 Einführung CO2-Preis in DE 2022 1,93 100,93 Ukraine-Krieg (Rekordpreise) 2023 1,79 82,18 Beruhigung der Lieferketten 2024 1,78 82,62 Erhöhung der CO2-Abgabe 2025 1,69 72,50 Globale Konjunkturflaute 2026* 2,08 103,50 Aktueller Nahost-Konflikt Mehr sehen
More images like this