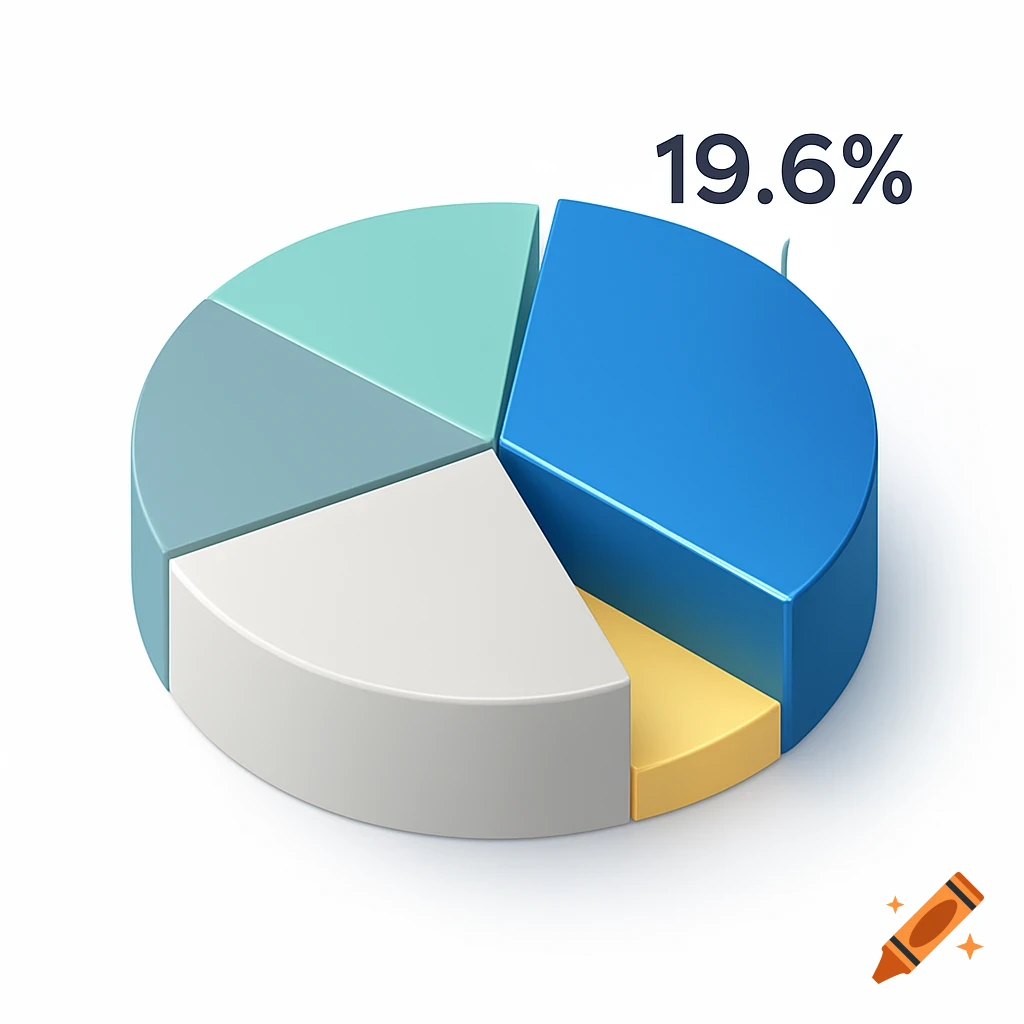
A 3D bar chart displaying election results for four candidates. Candidate 1 (blue) and Candidate 2 (green) both have 34%, Candidate 3 (orange) has 19%, and Candidate 4 (red) has 13%.
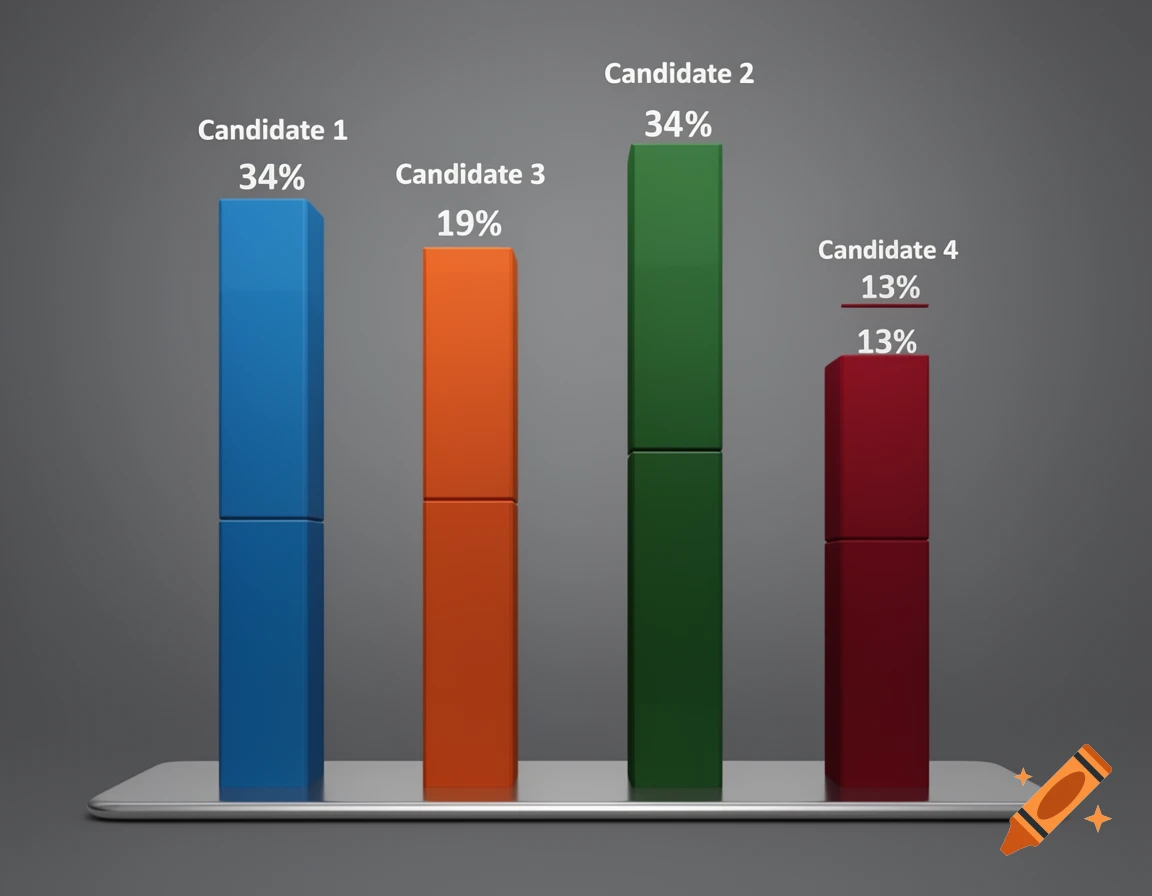
Erstelle ein Balkendiagramm mit Wahlergebnissen von 4 Personen in jeweils anderen Farben bei den Balken. Kandidat 1 hat 34%, Kandidat 2 ebenfalls, Kandidat 3 liegt bei 19% und Kandidat 4 bei 13%. Mehr sehen
More images like this