


Heatmap Visualization of Veridia City

Edited
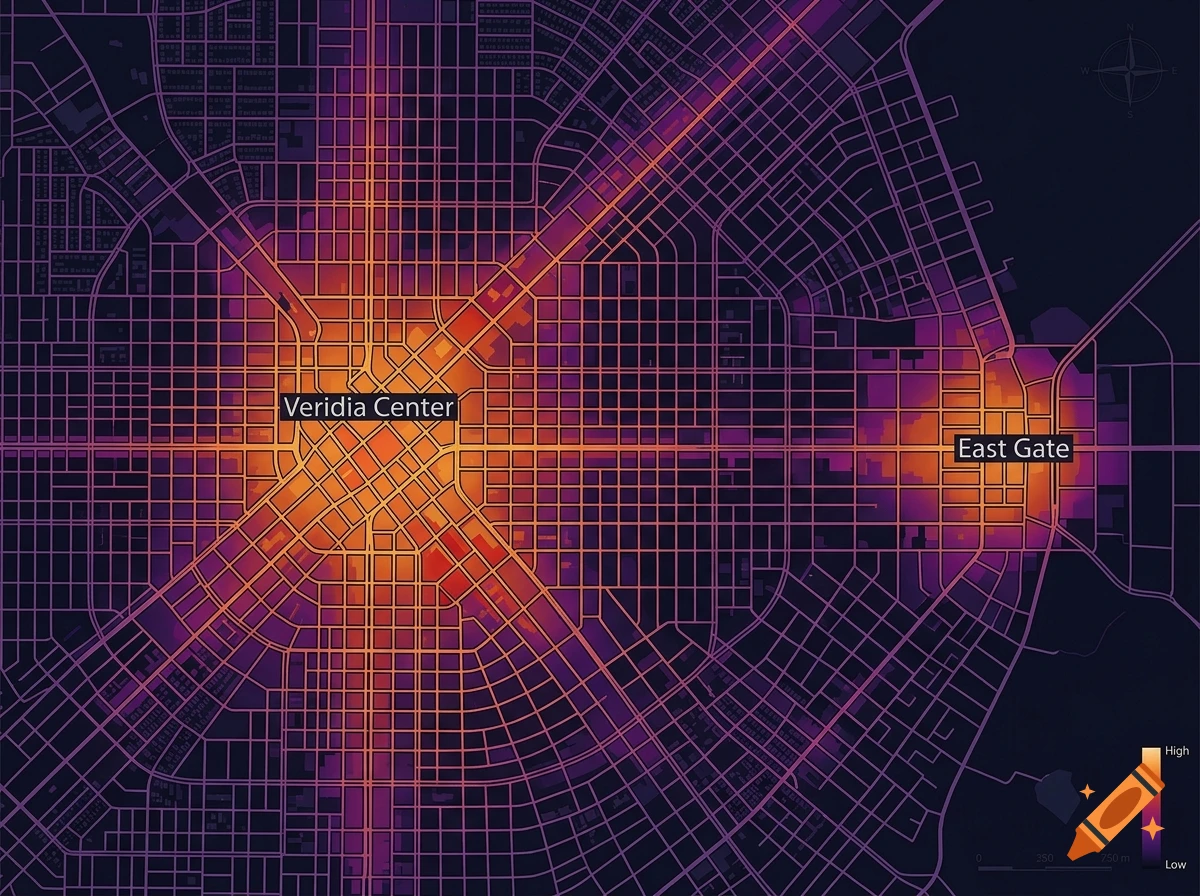
Clean vector heat map of New Veridia city grid, showing density from dark purple to orange, labeled 'Veridia Center' and 'East Gate'
More images like this

Edited
Clean vector heat map of New Veridia city grid, showing density from dark purple to orange, labeled 'Veridia Center' and 'East Gate'