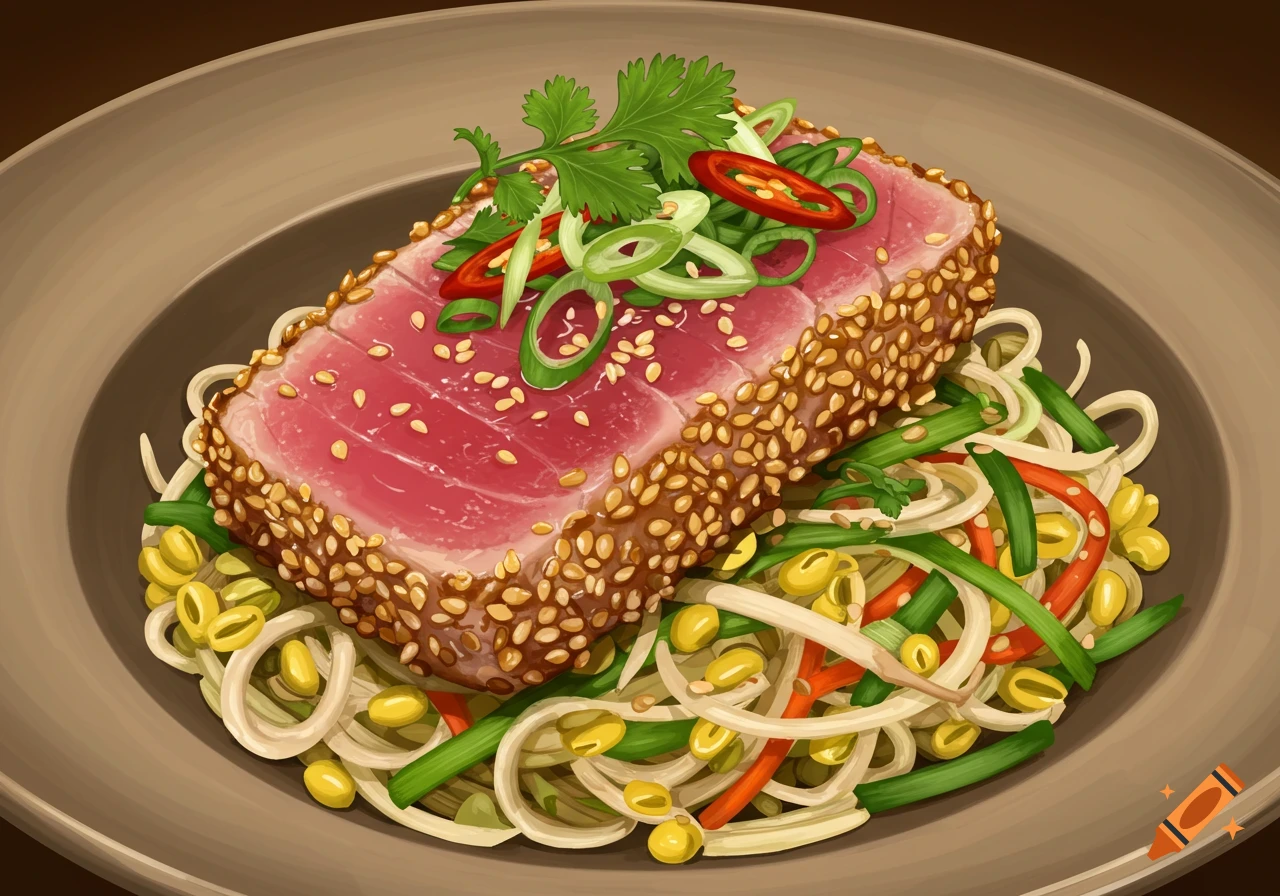
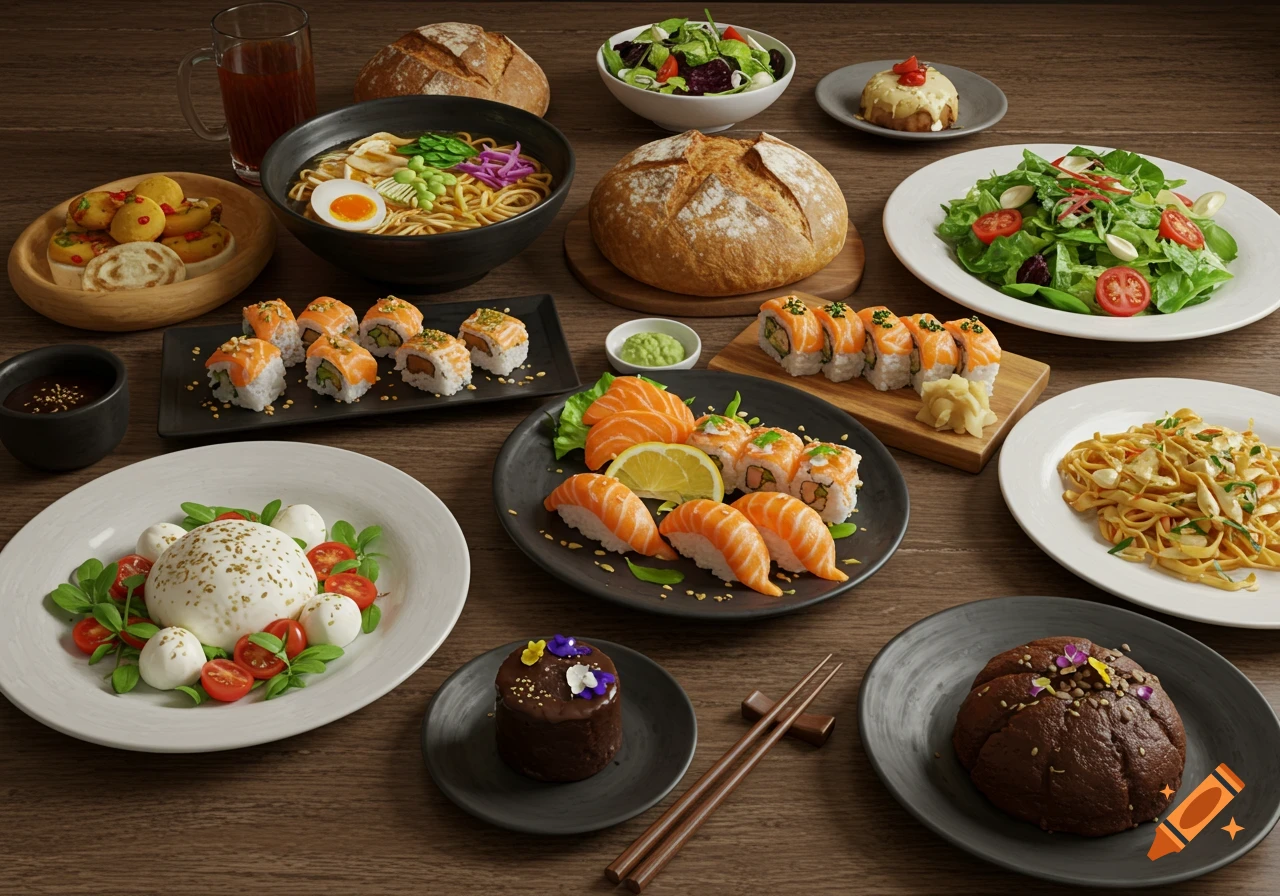
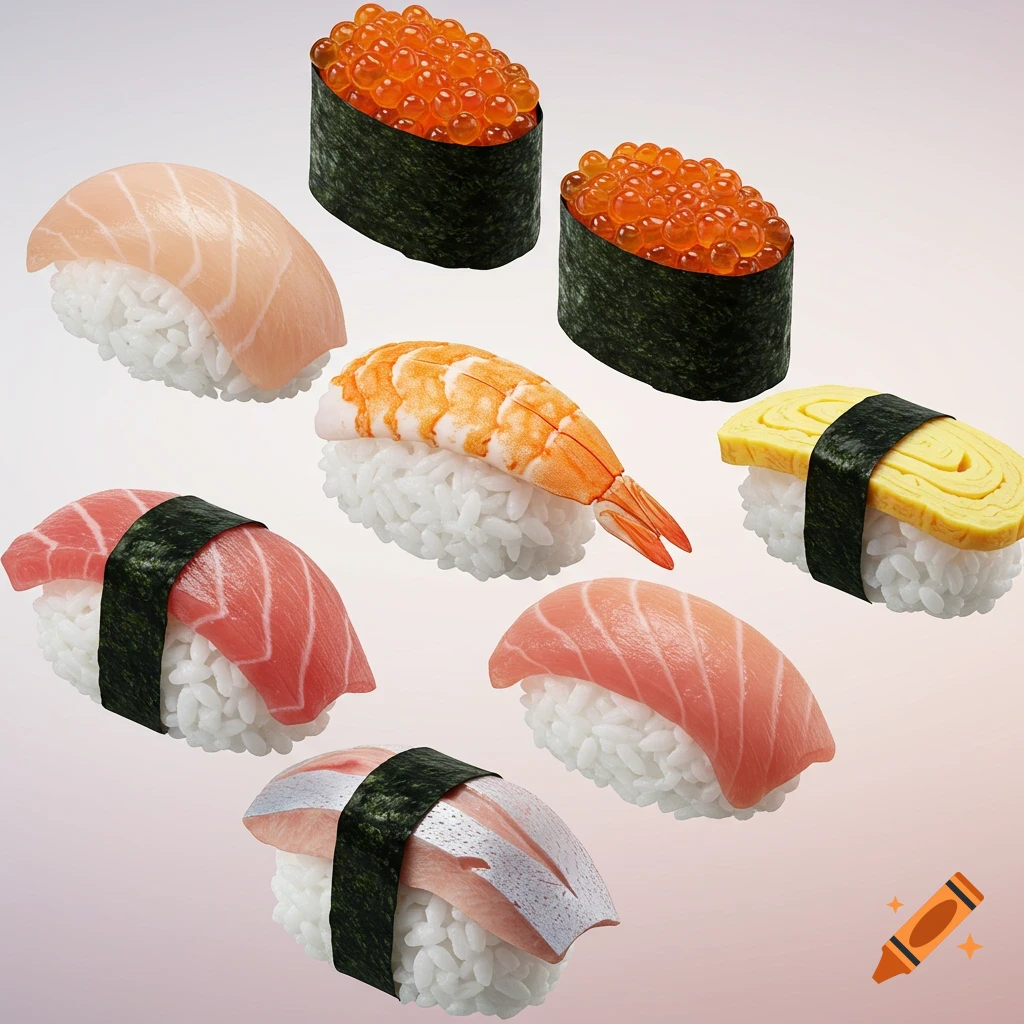
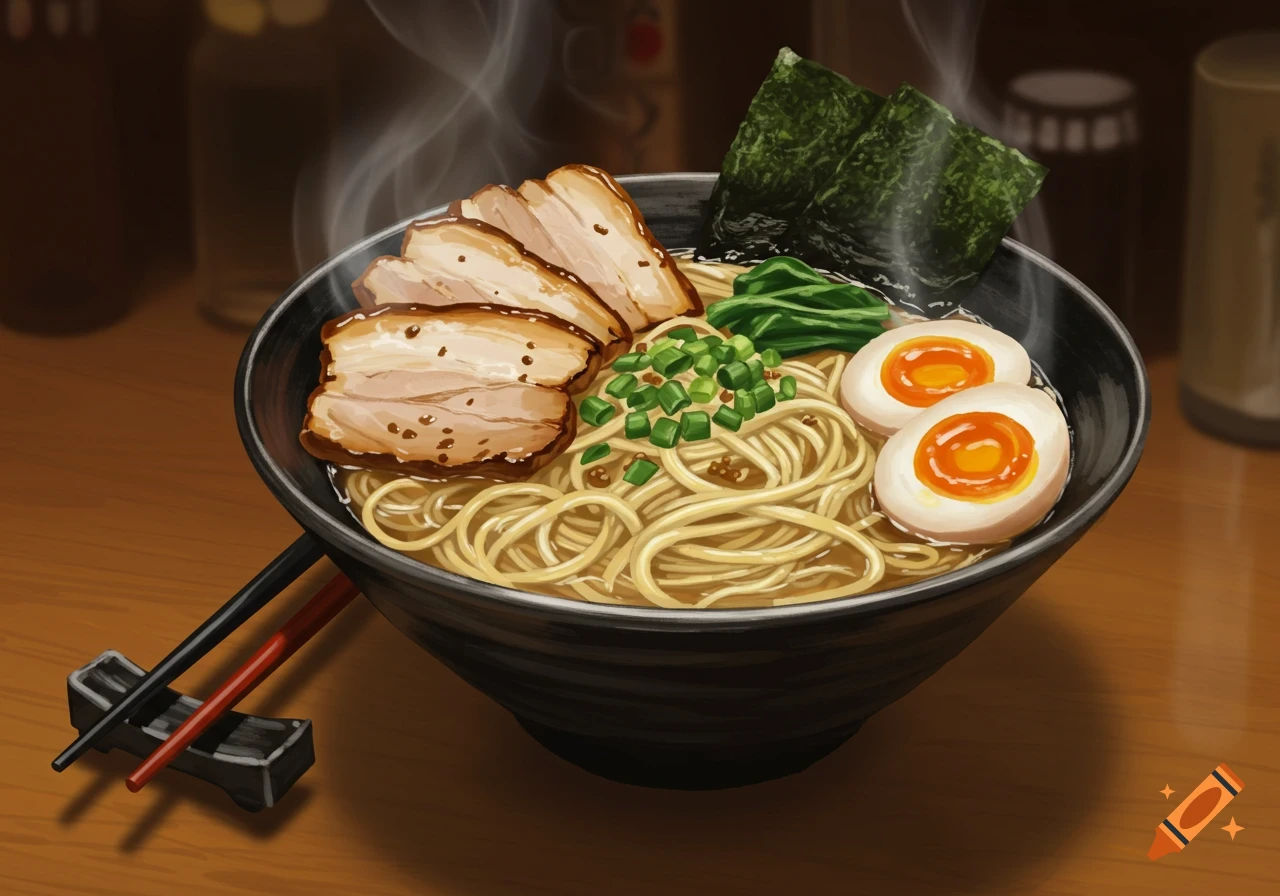
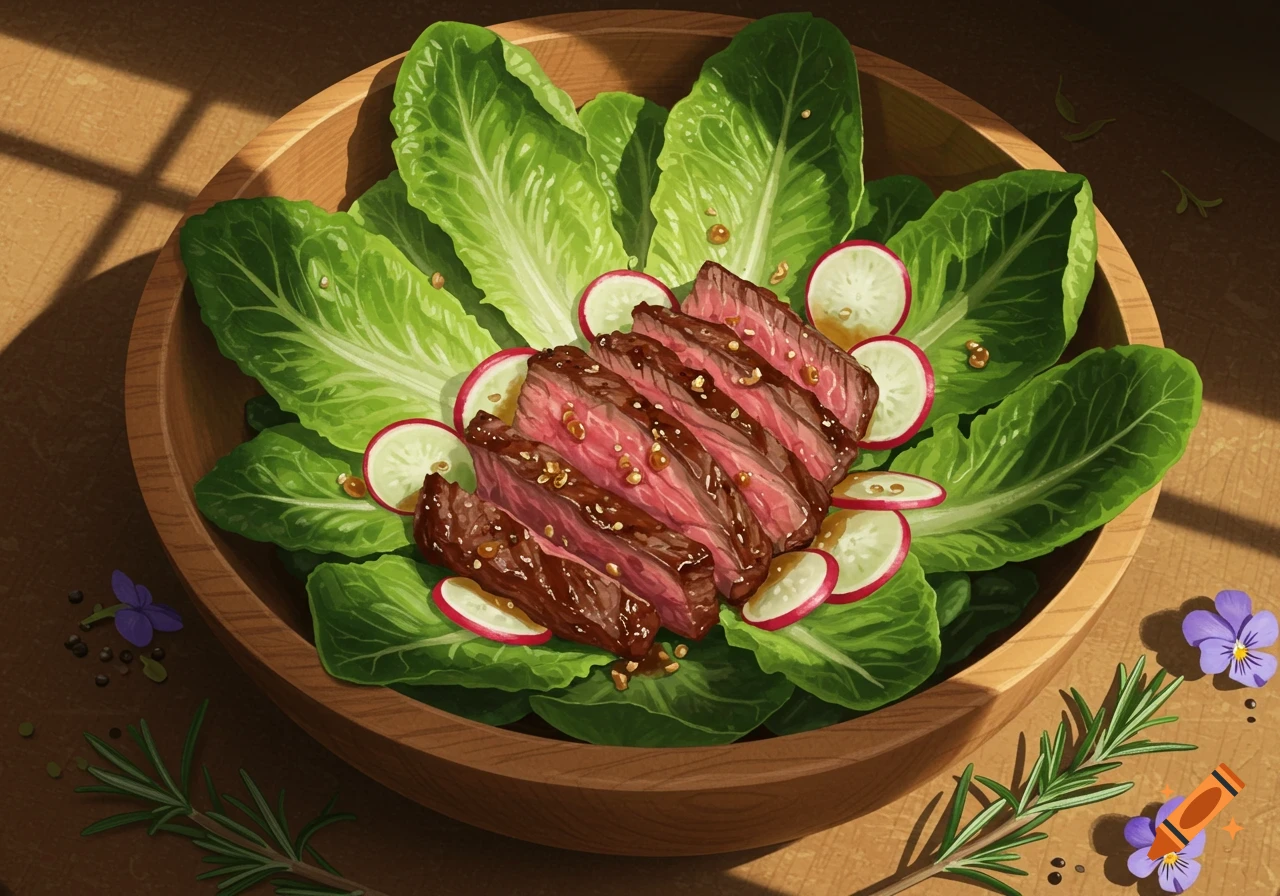
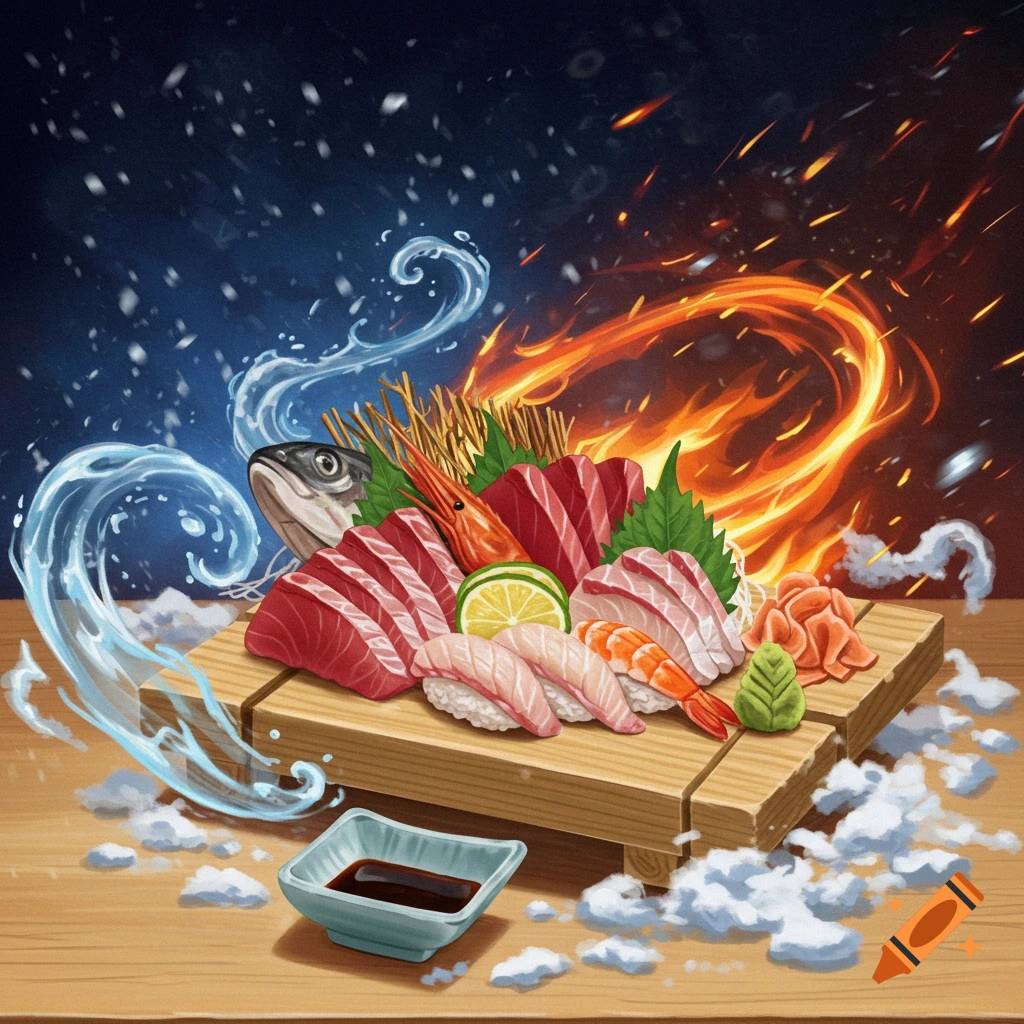
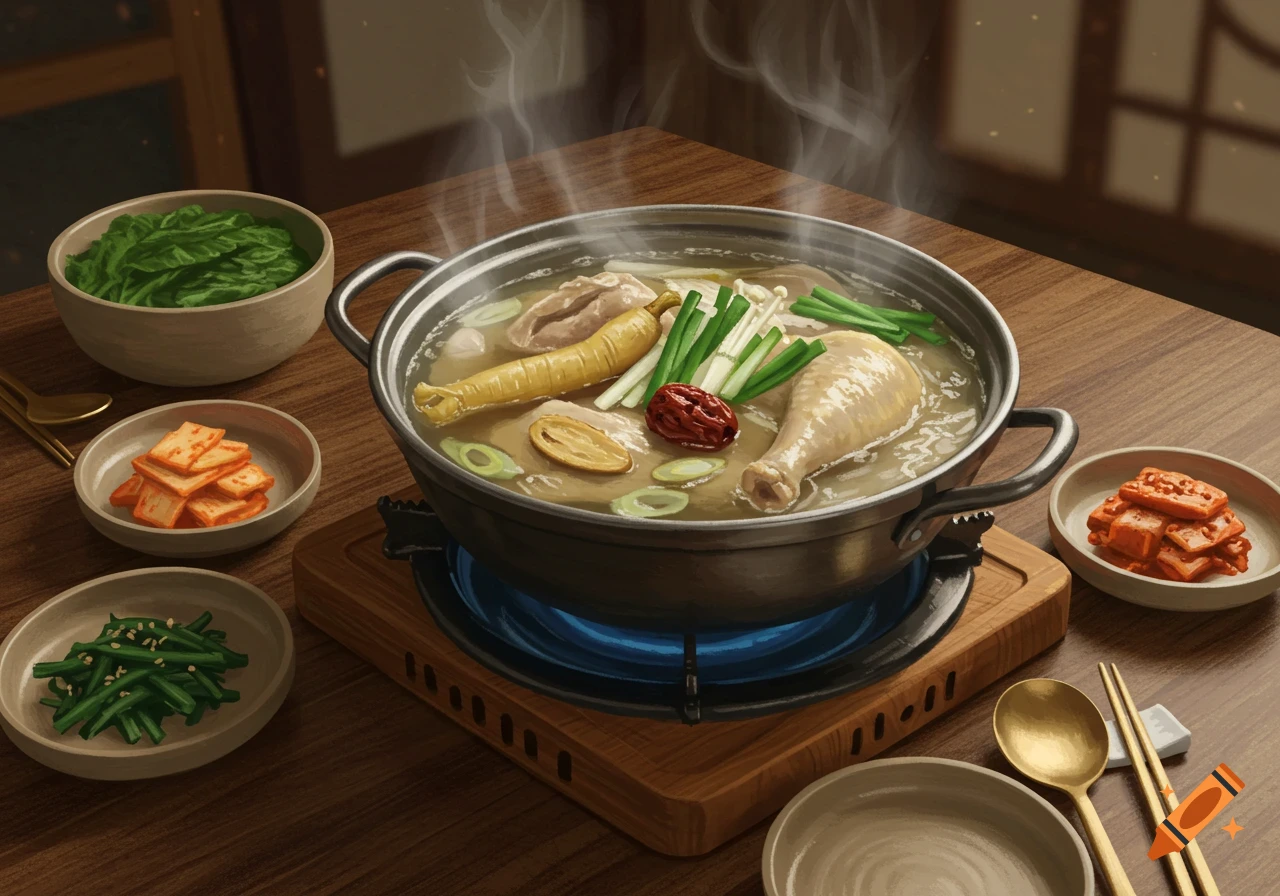
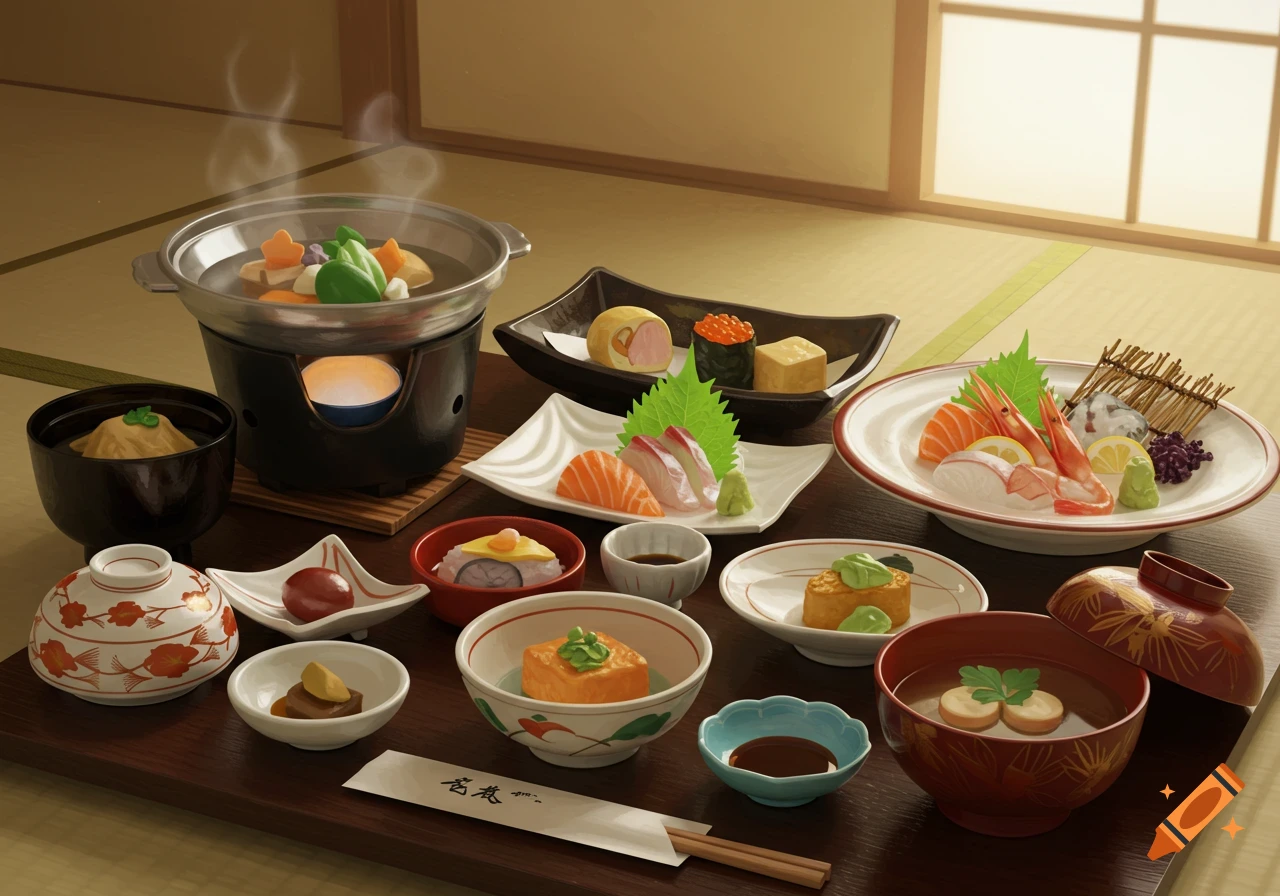
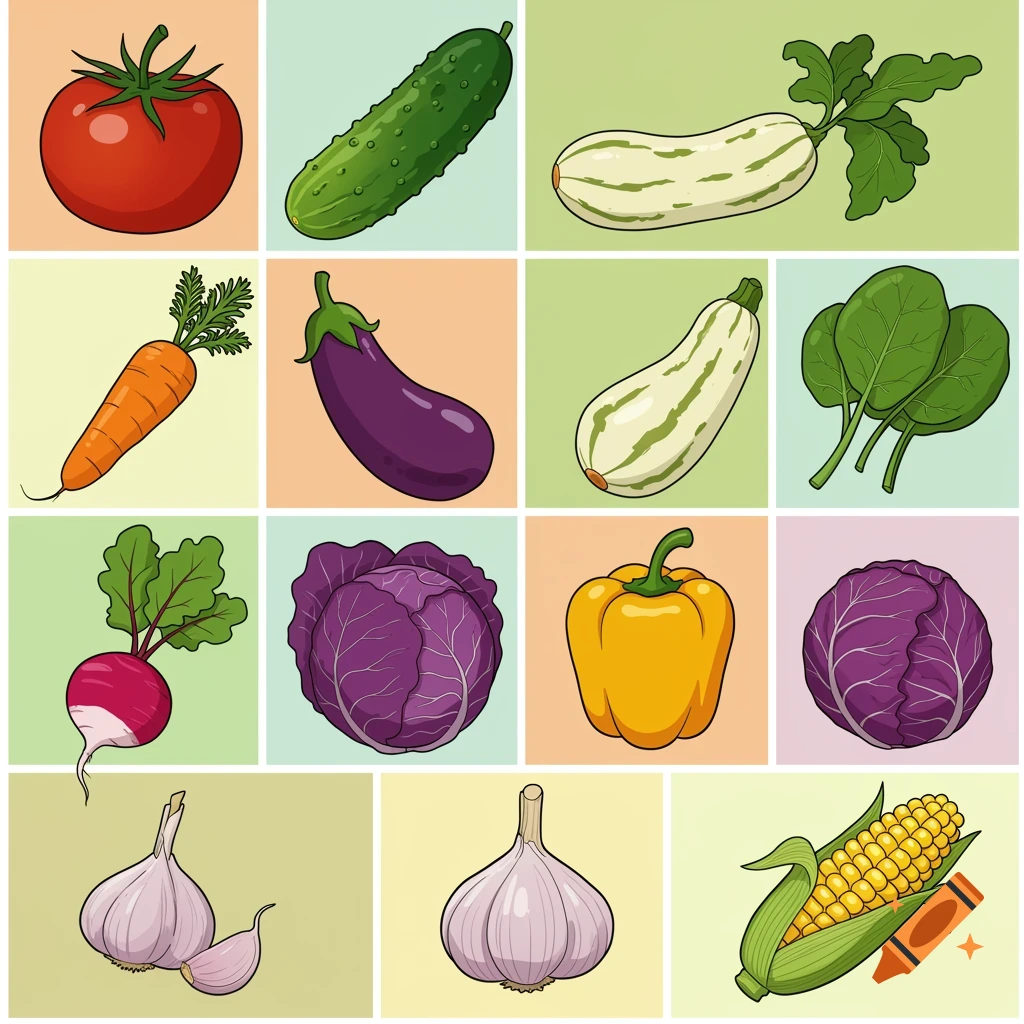
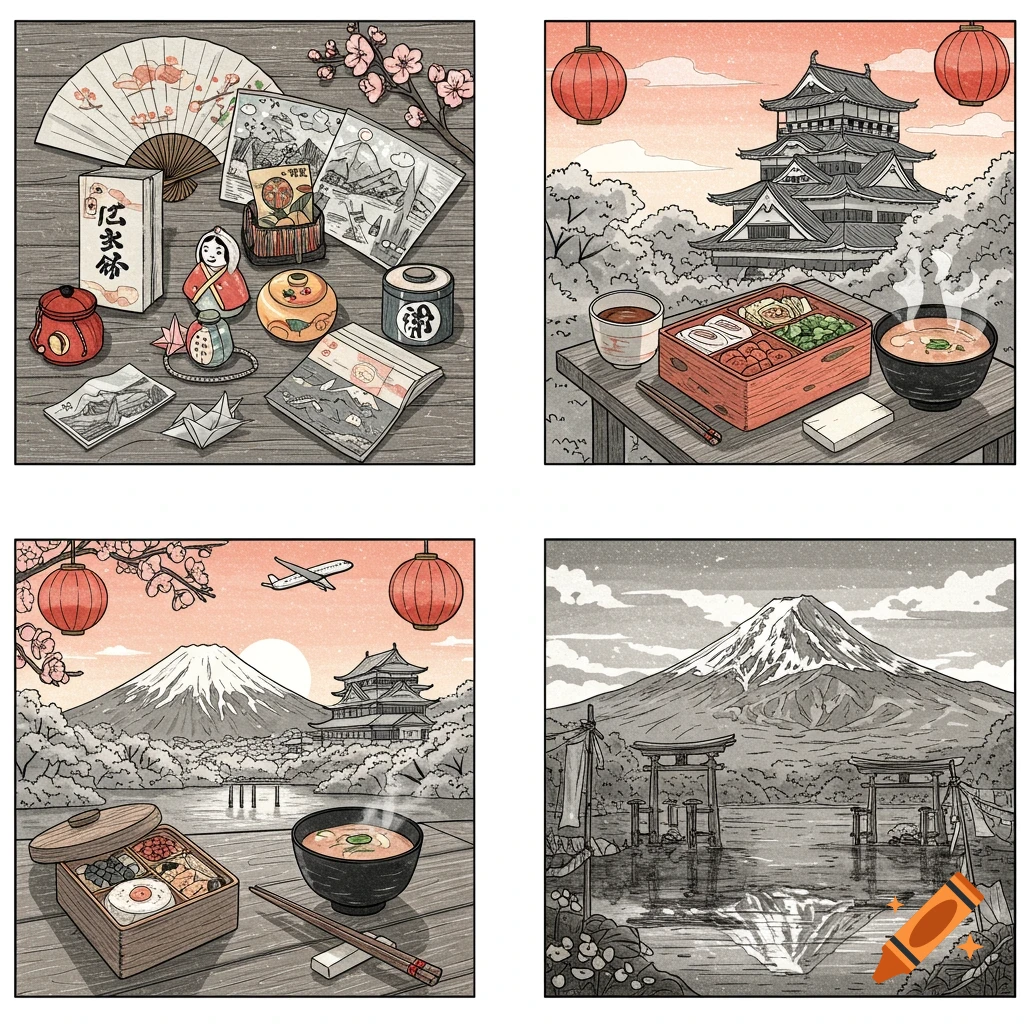
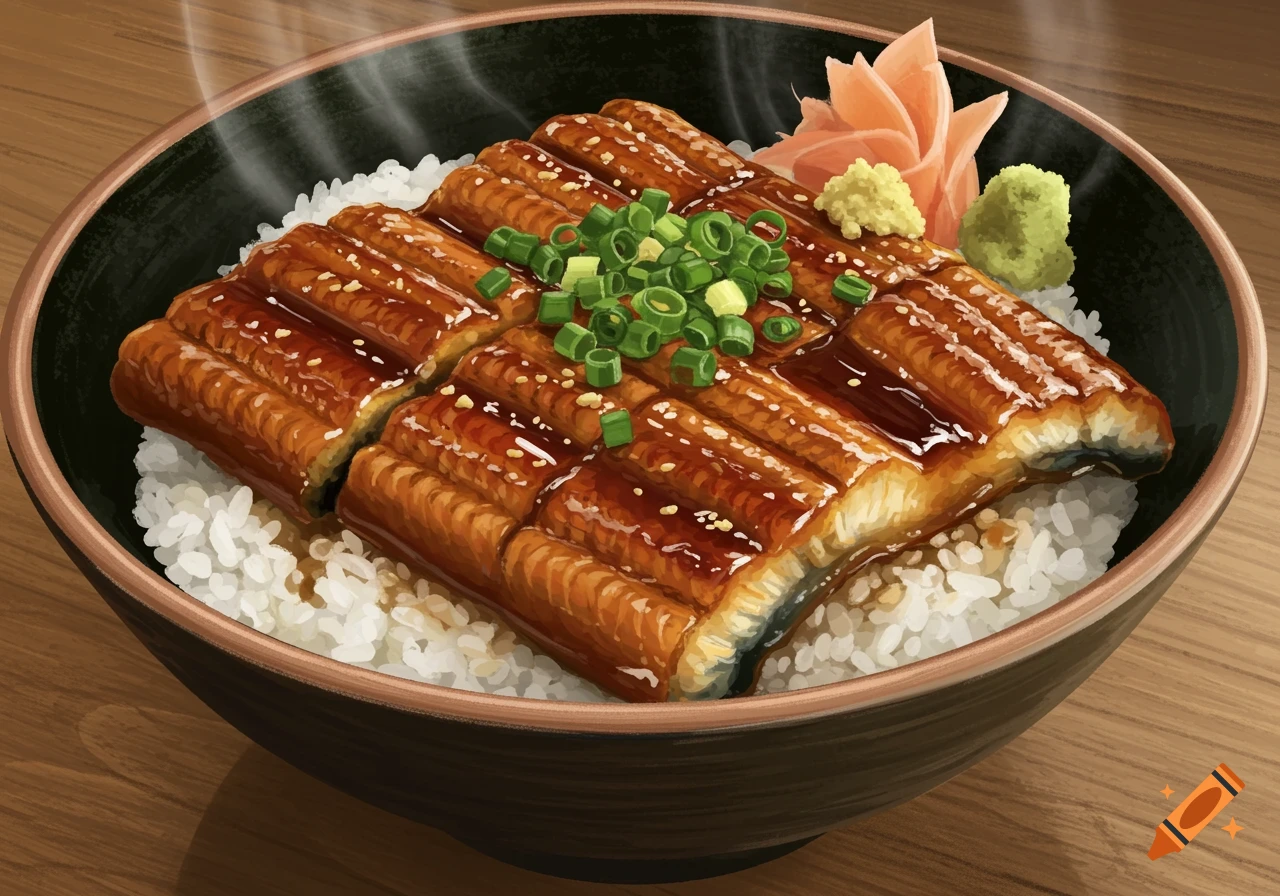
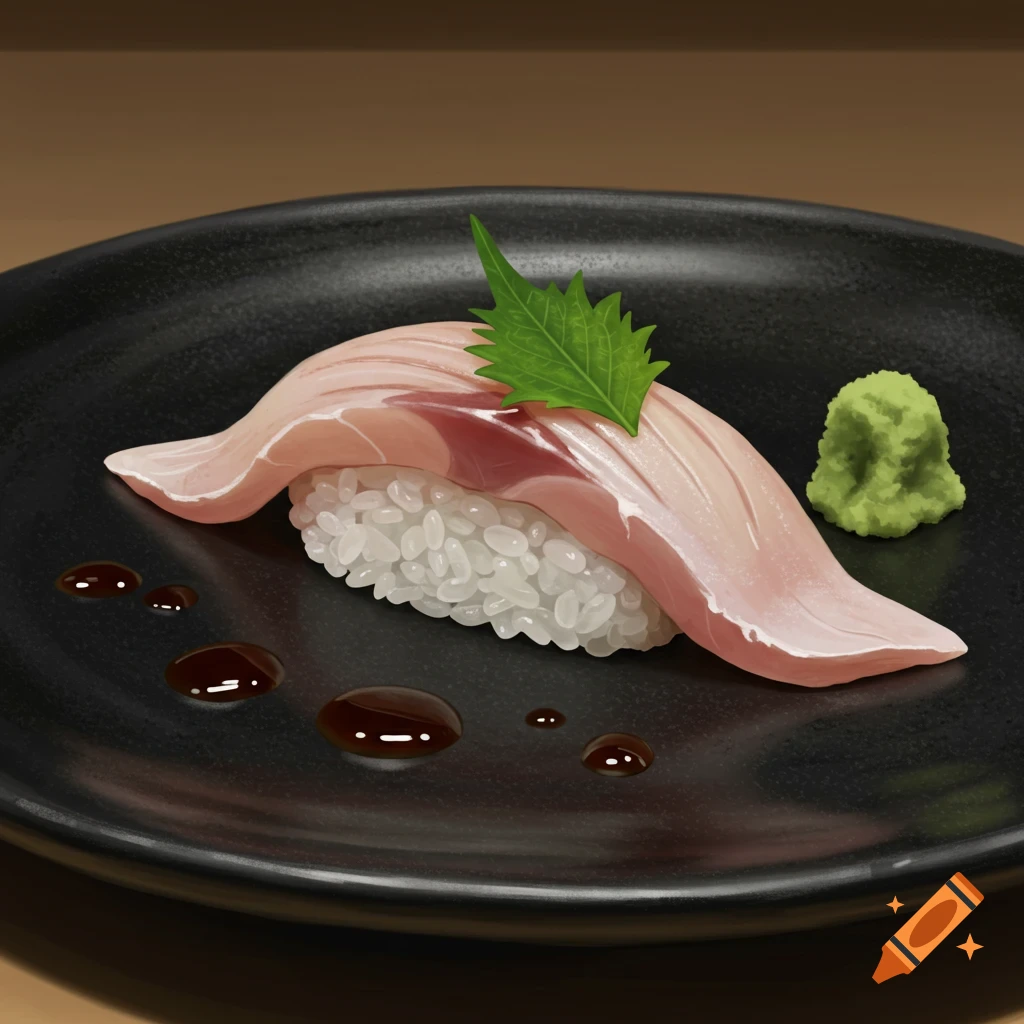
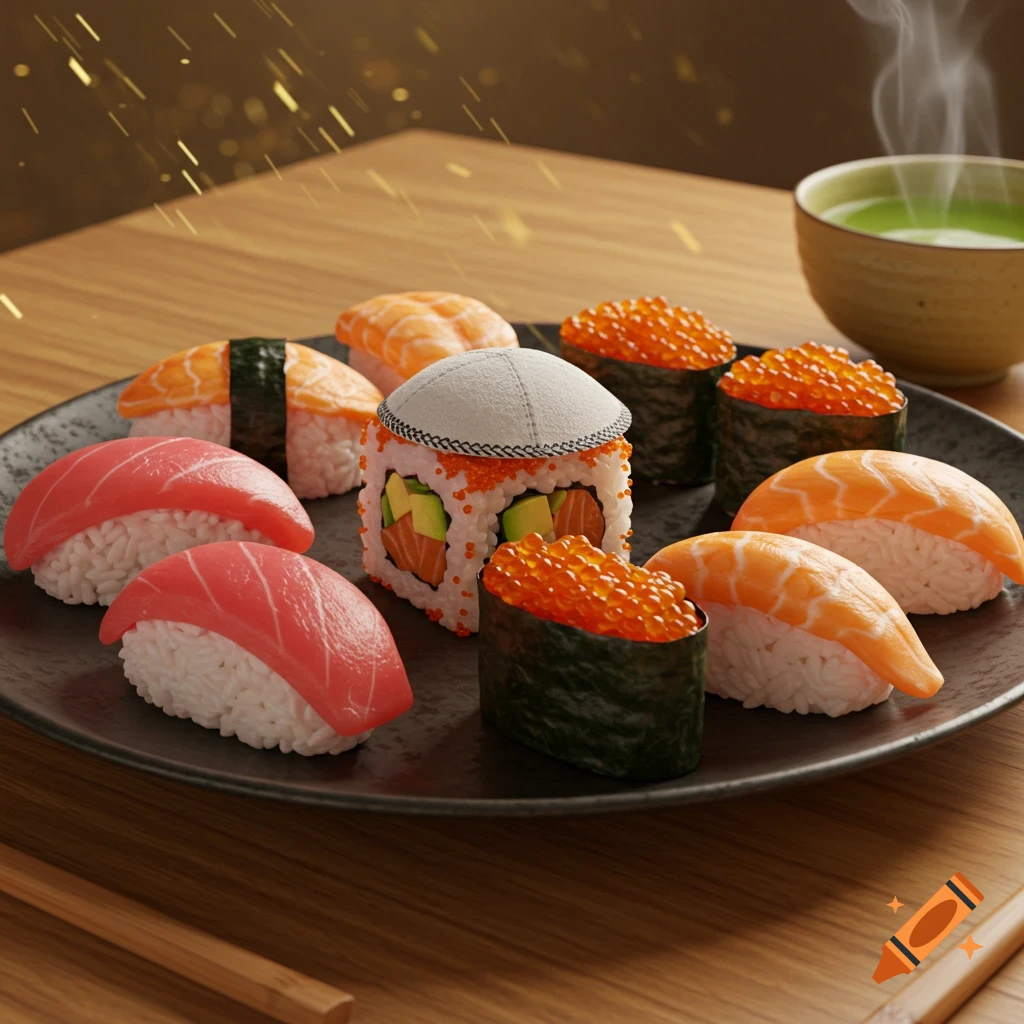
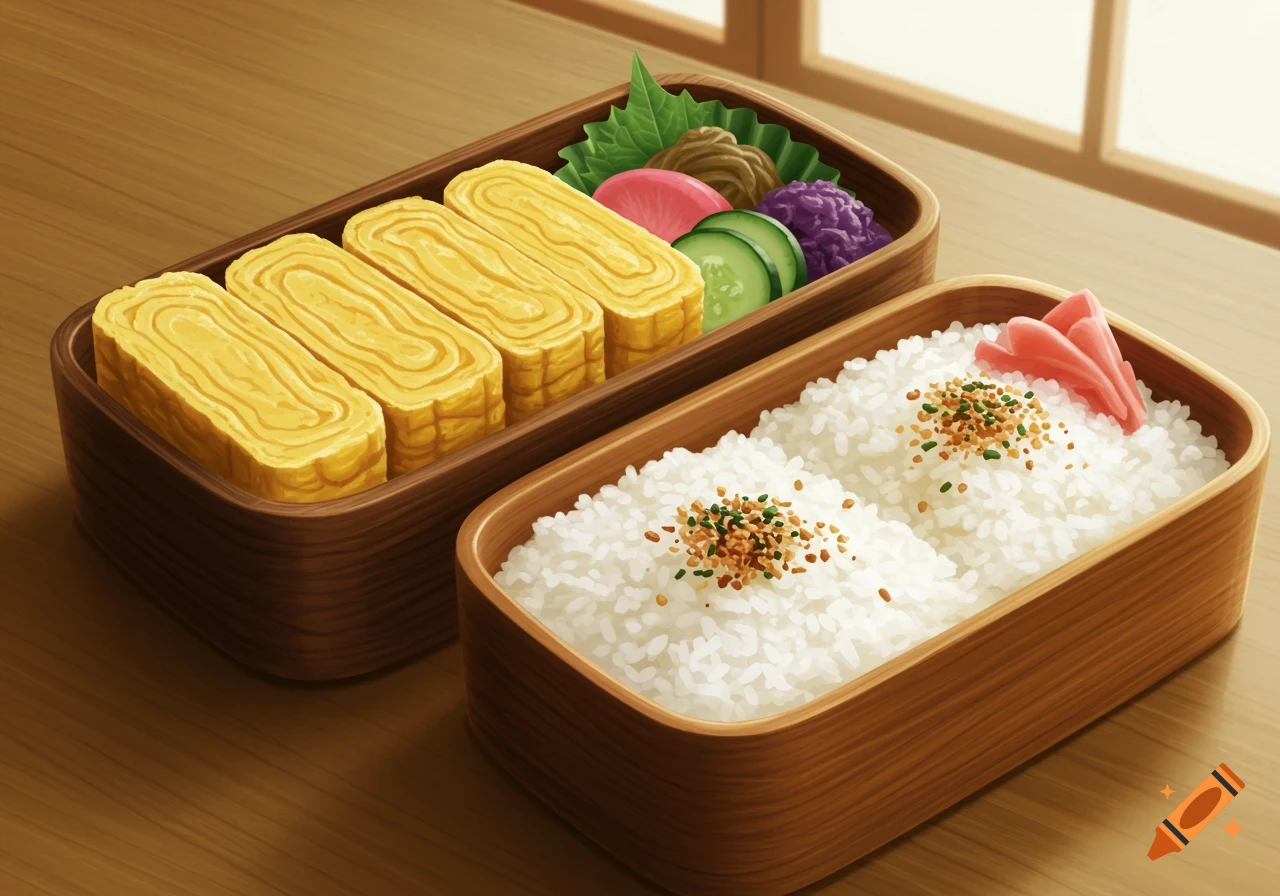
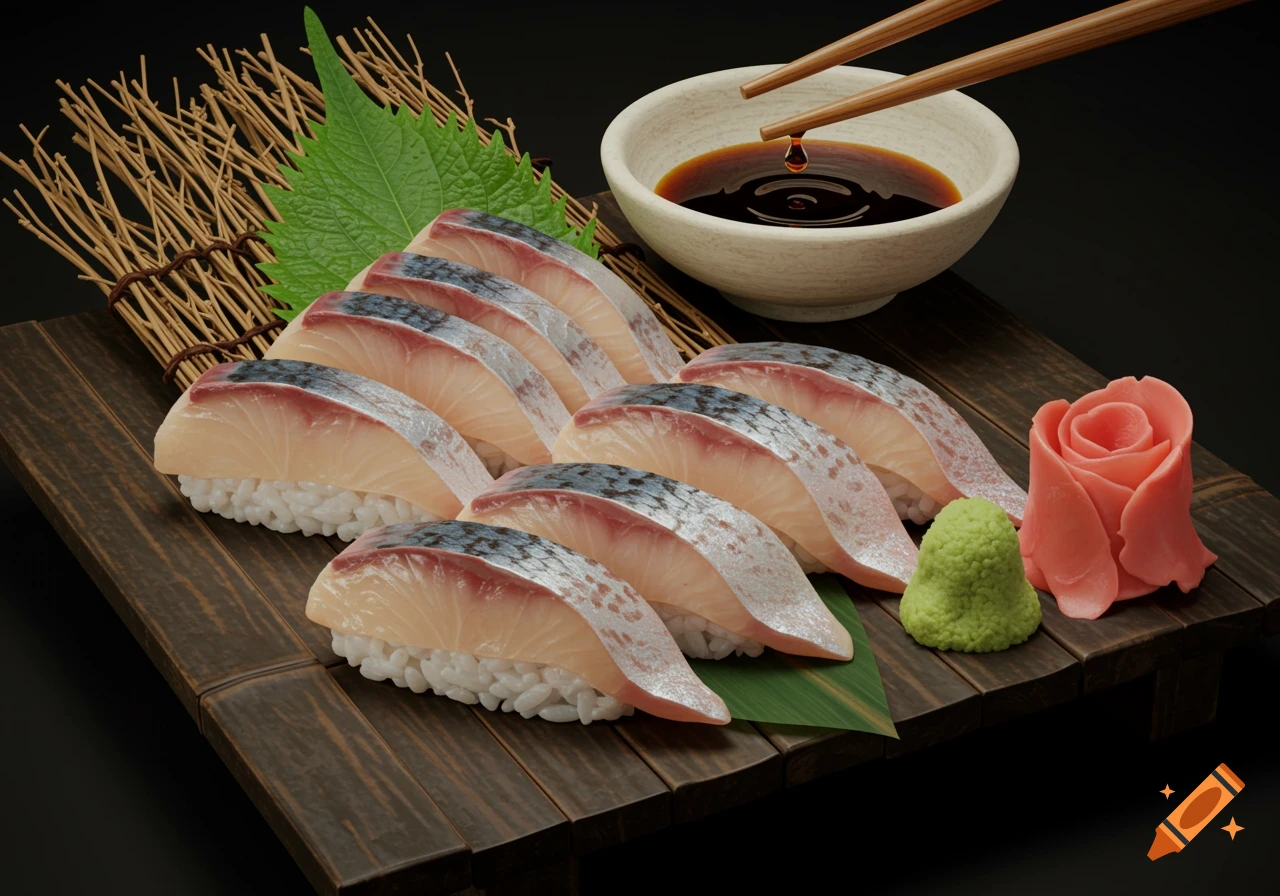
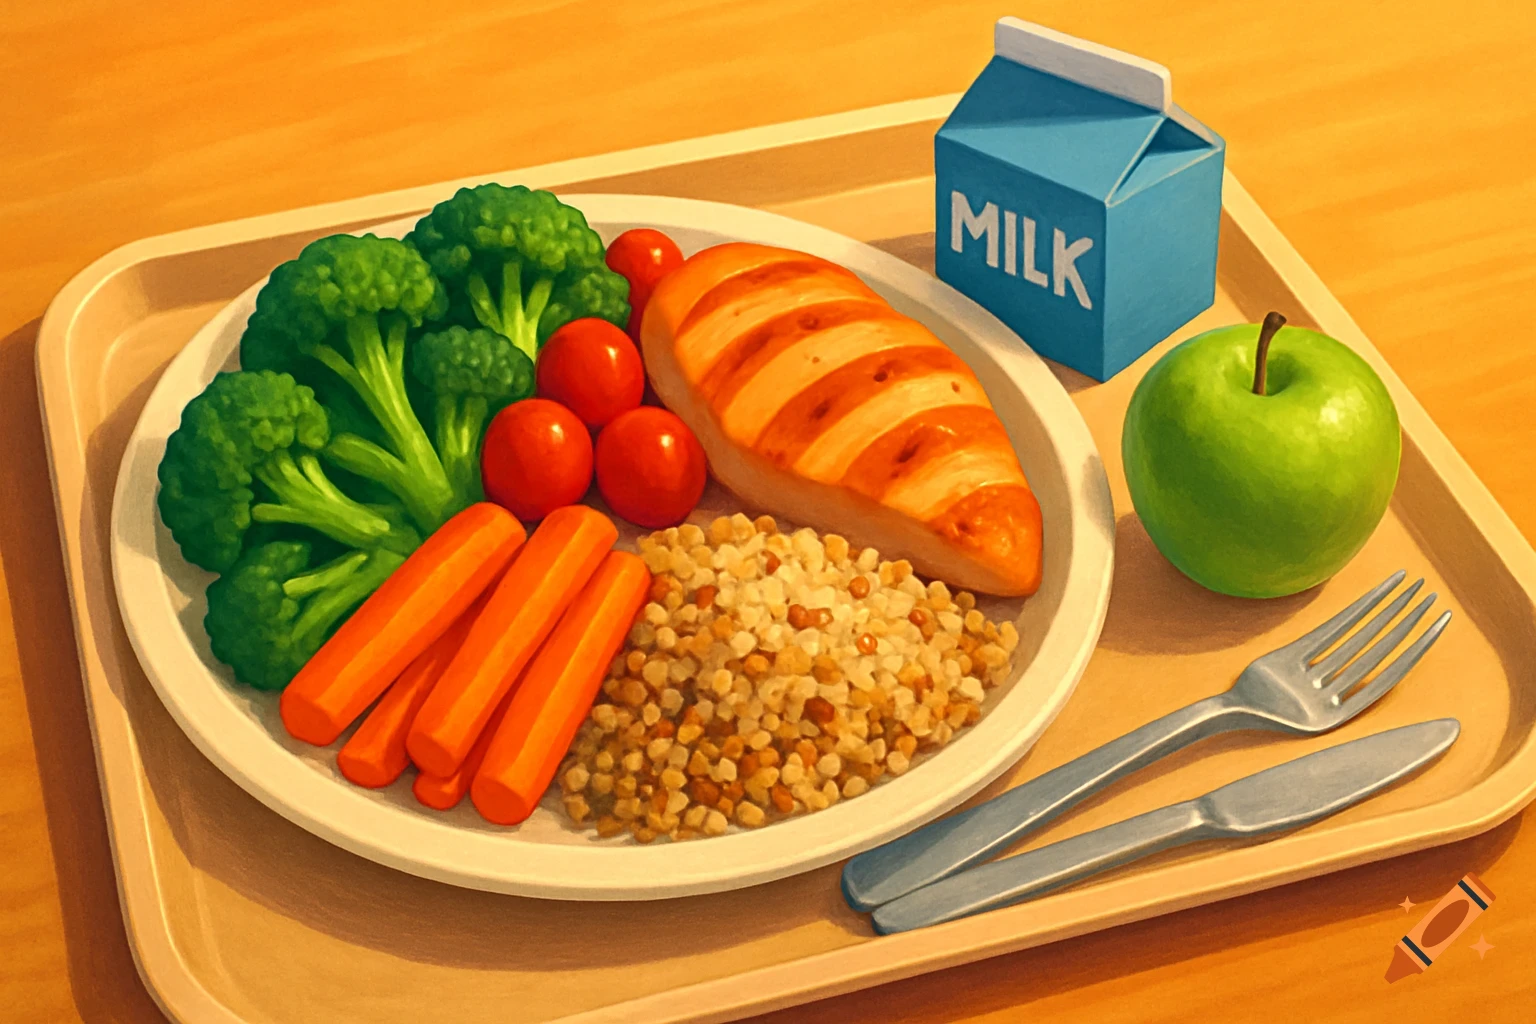
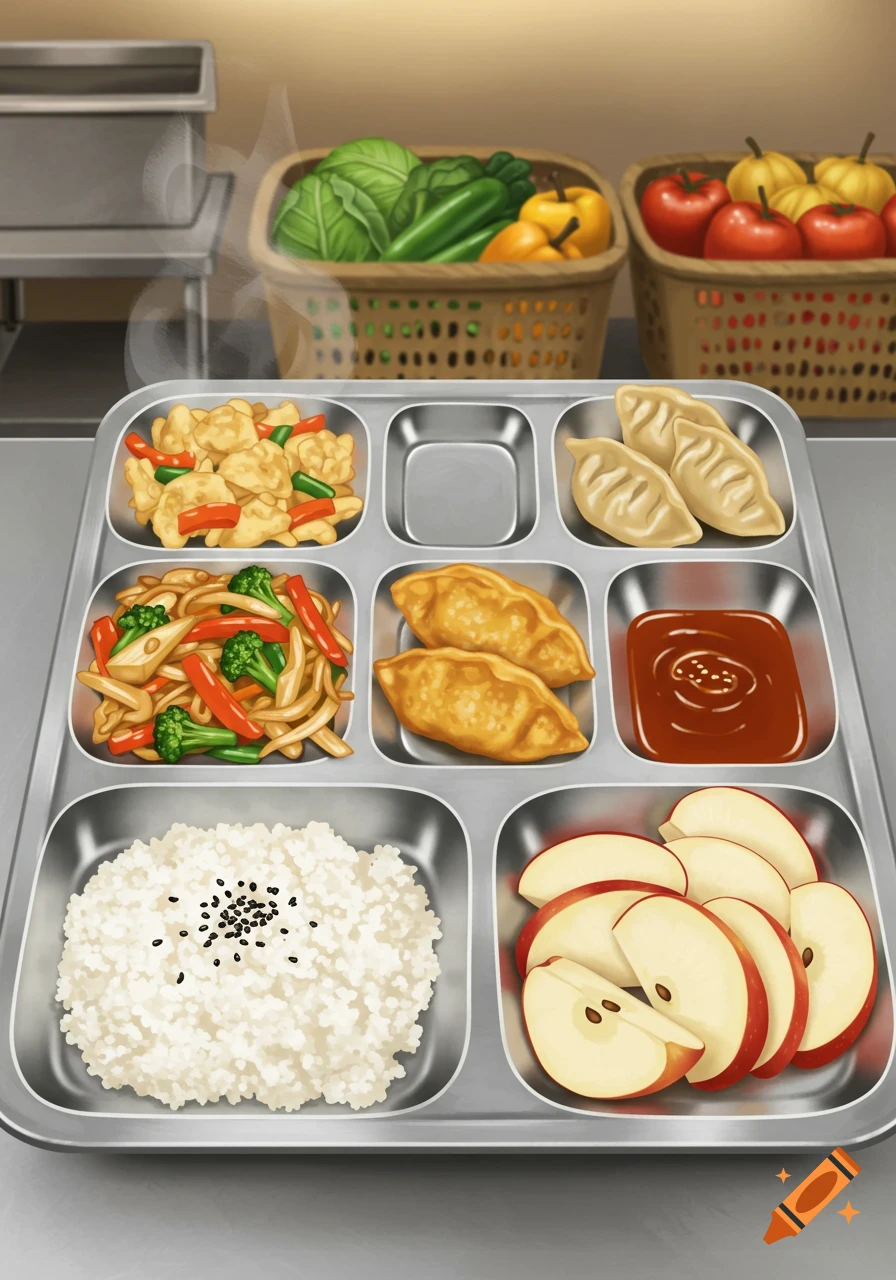
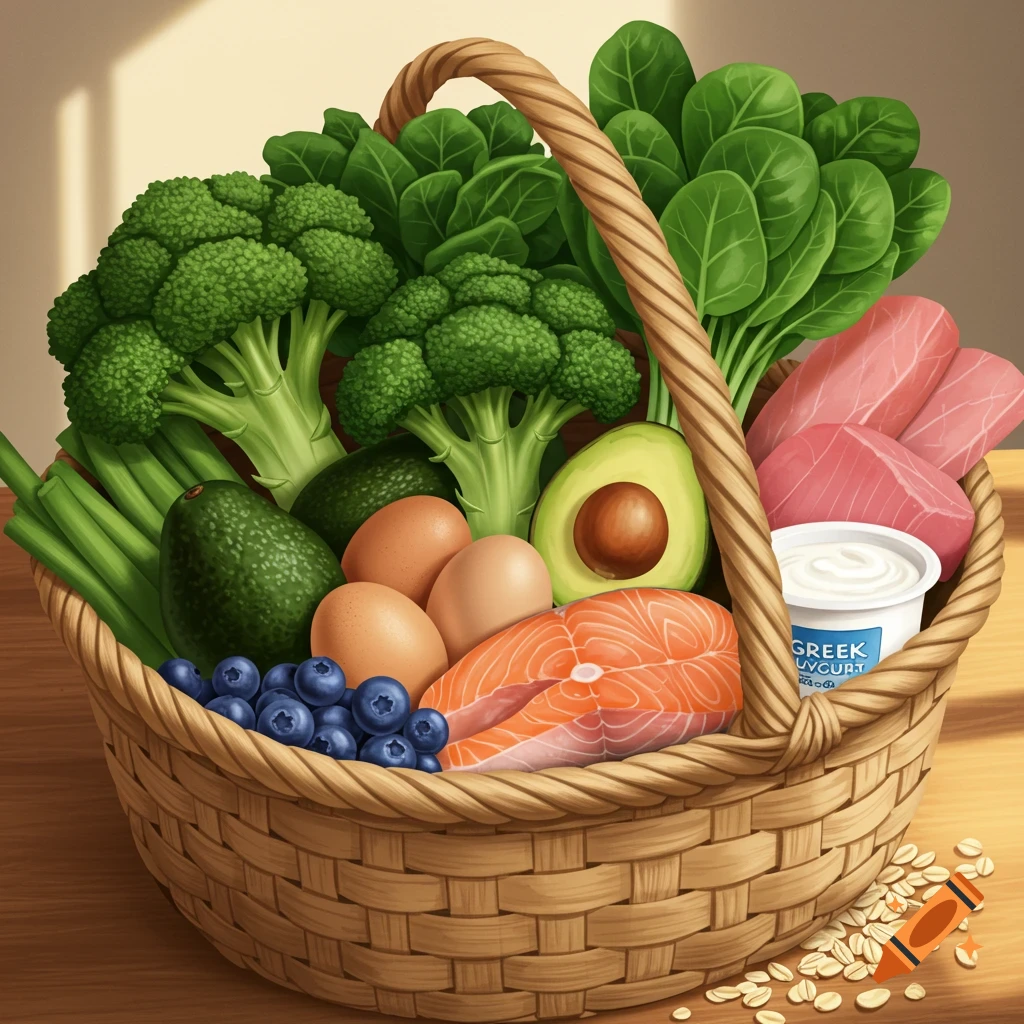
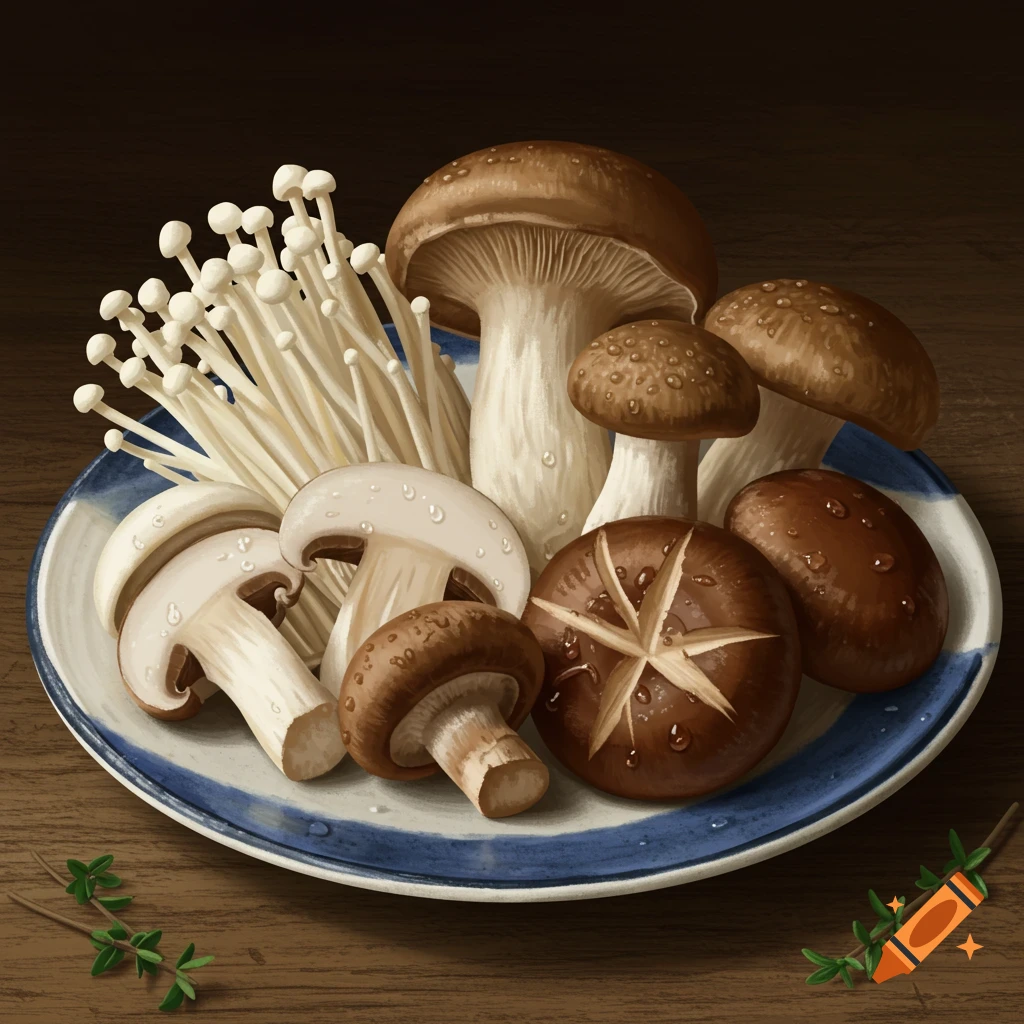
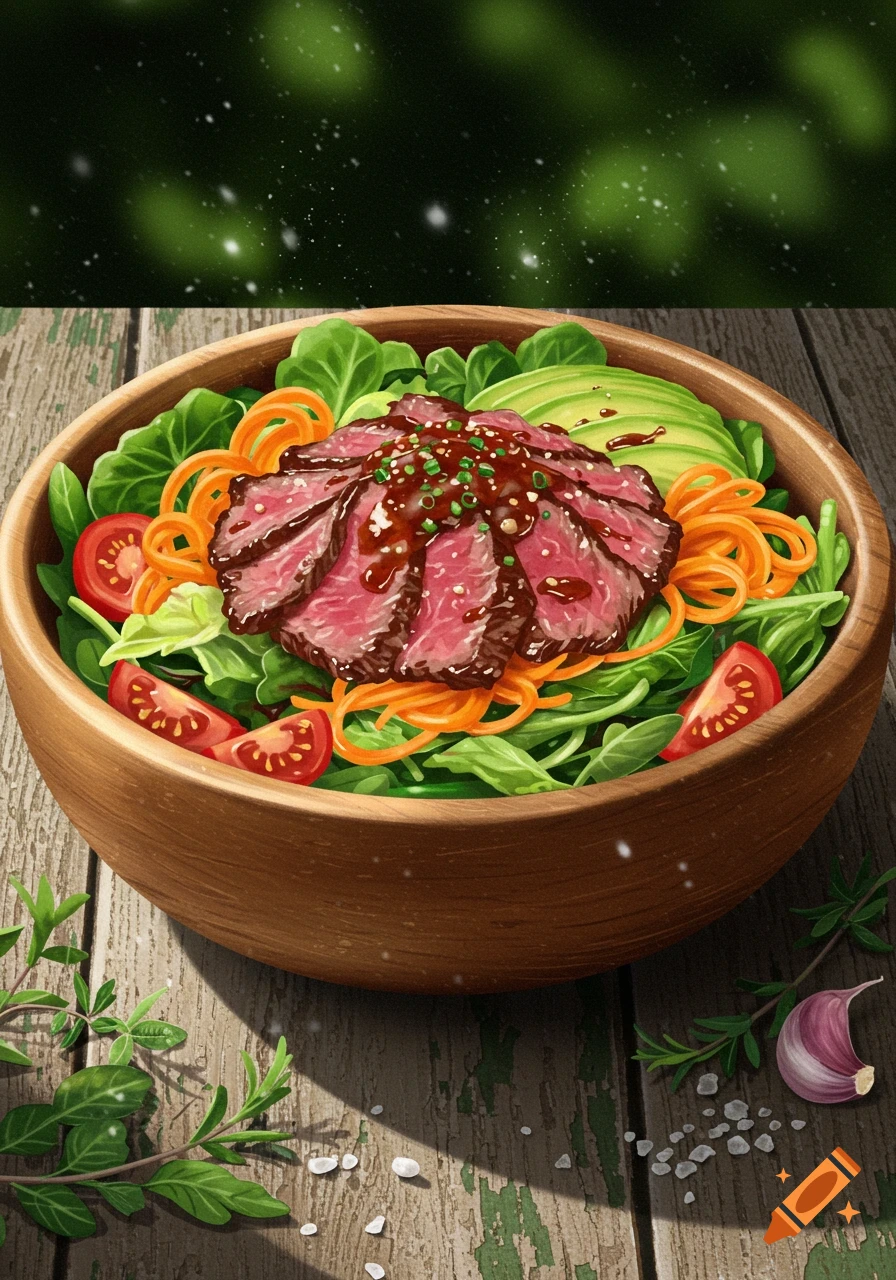
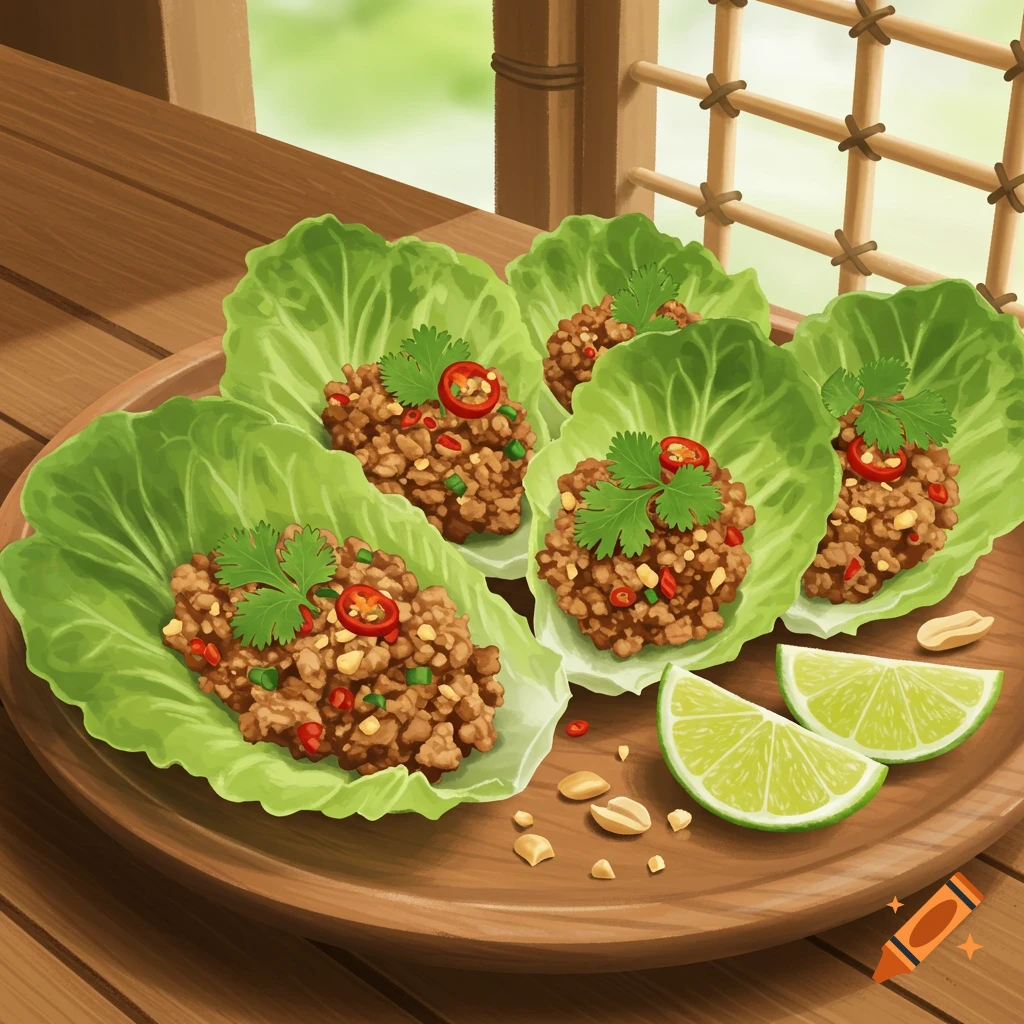
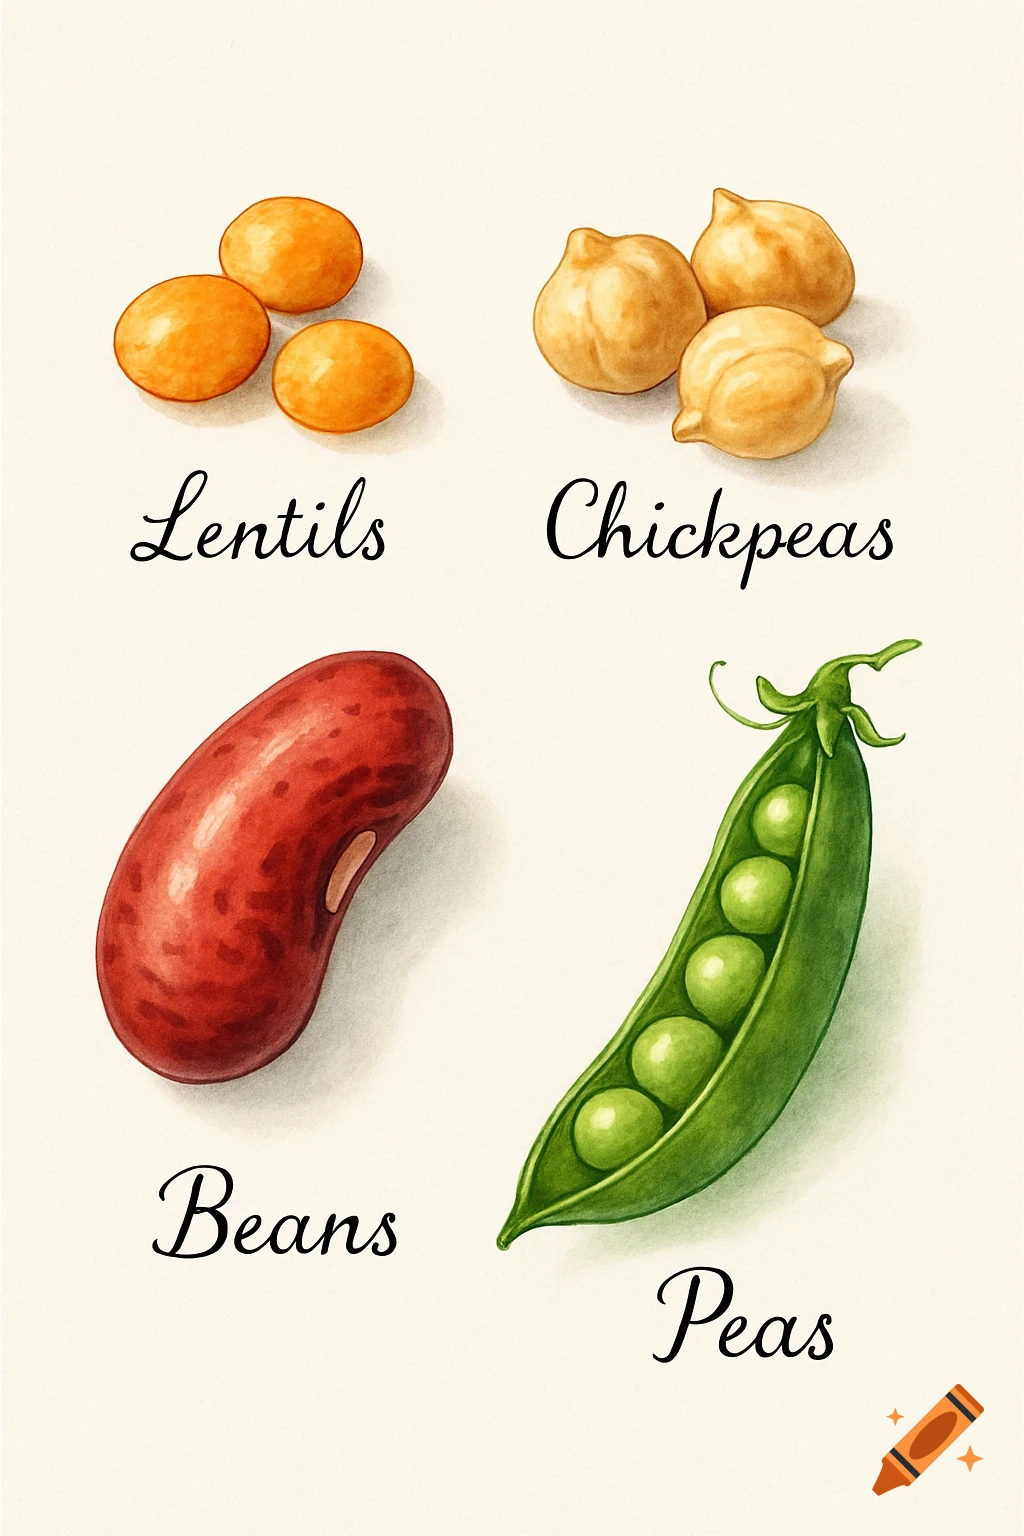
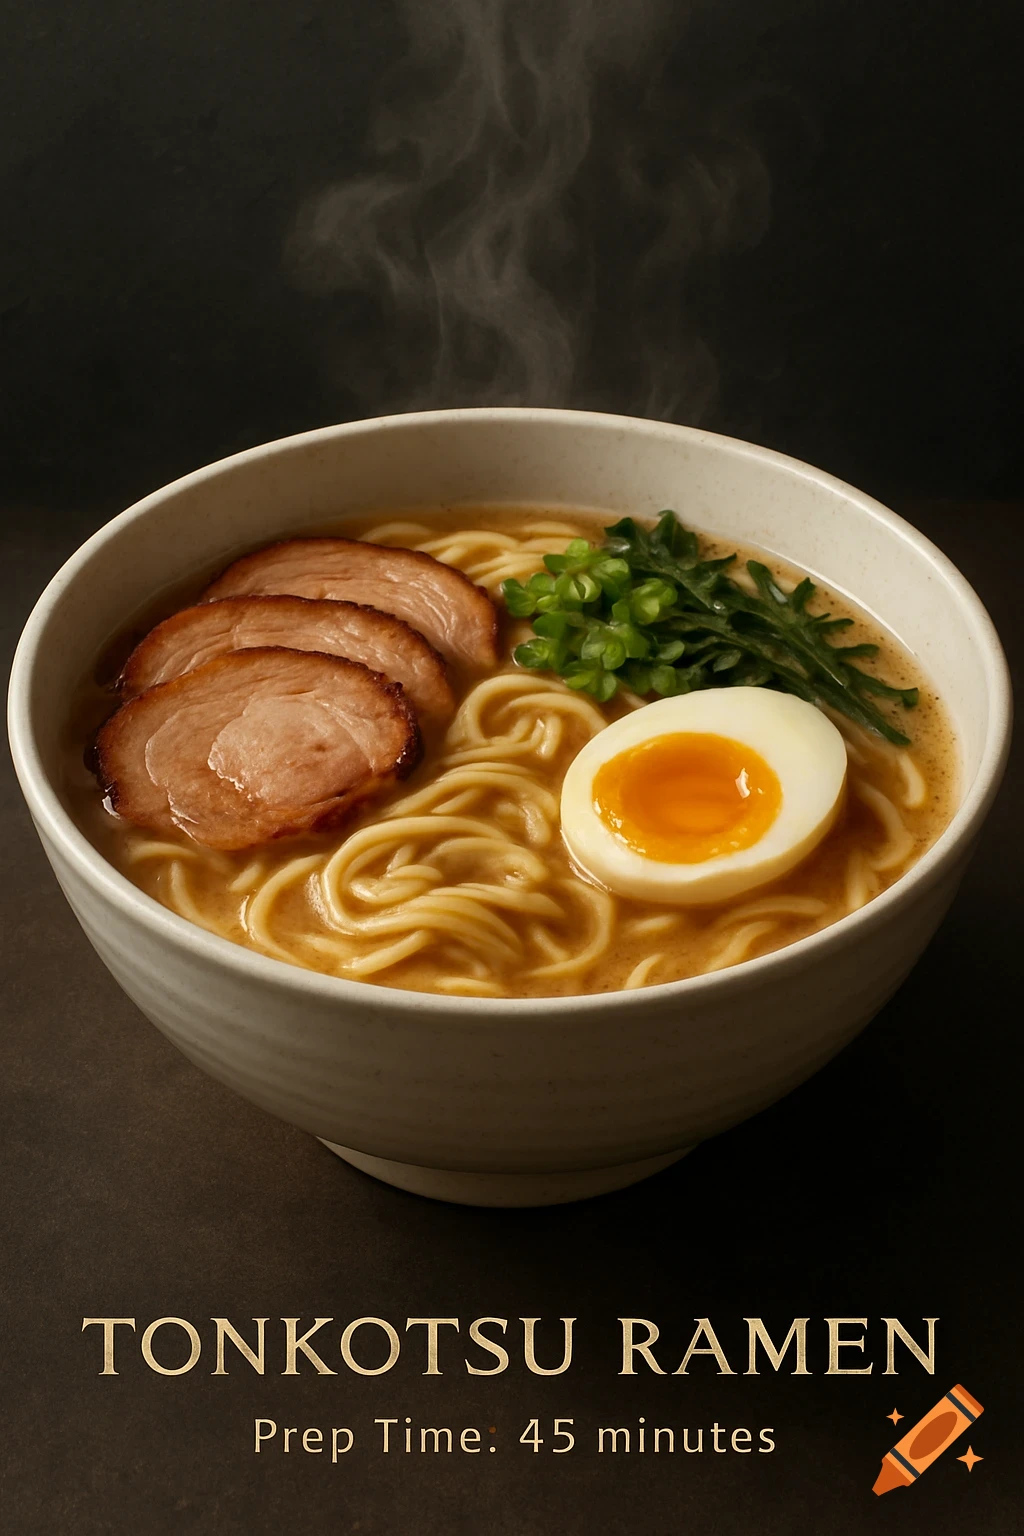
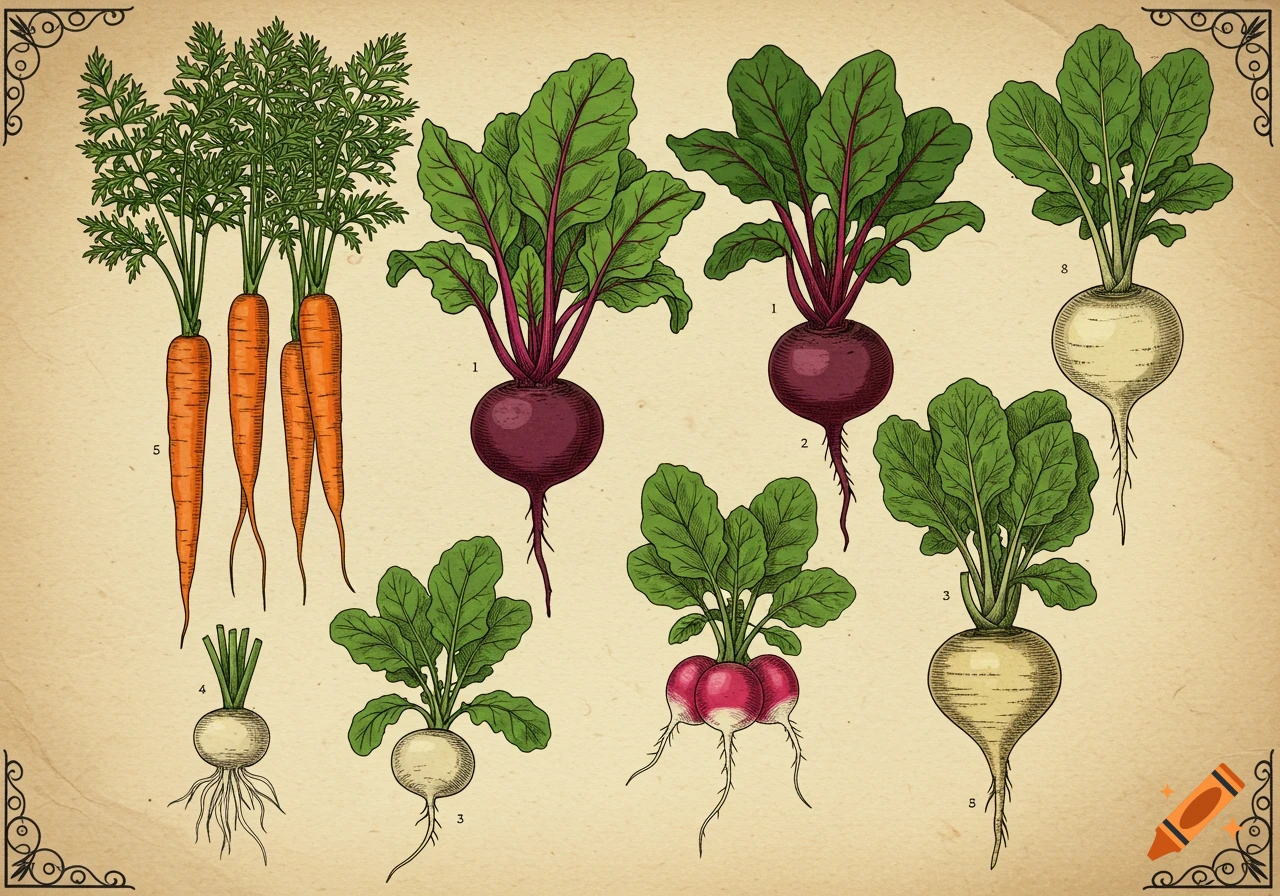
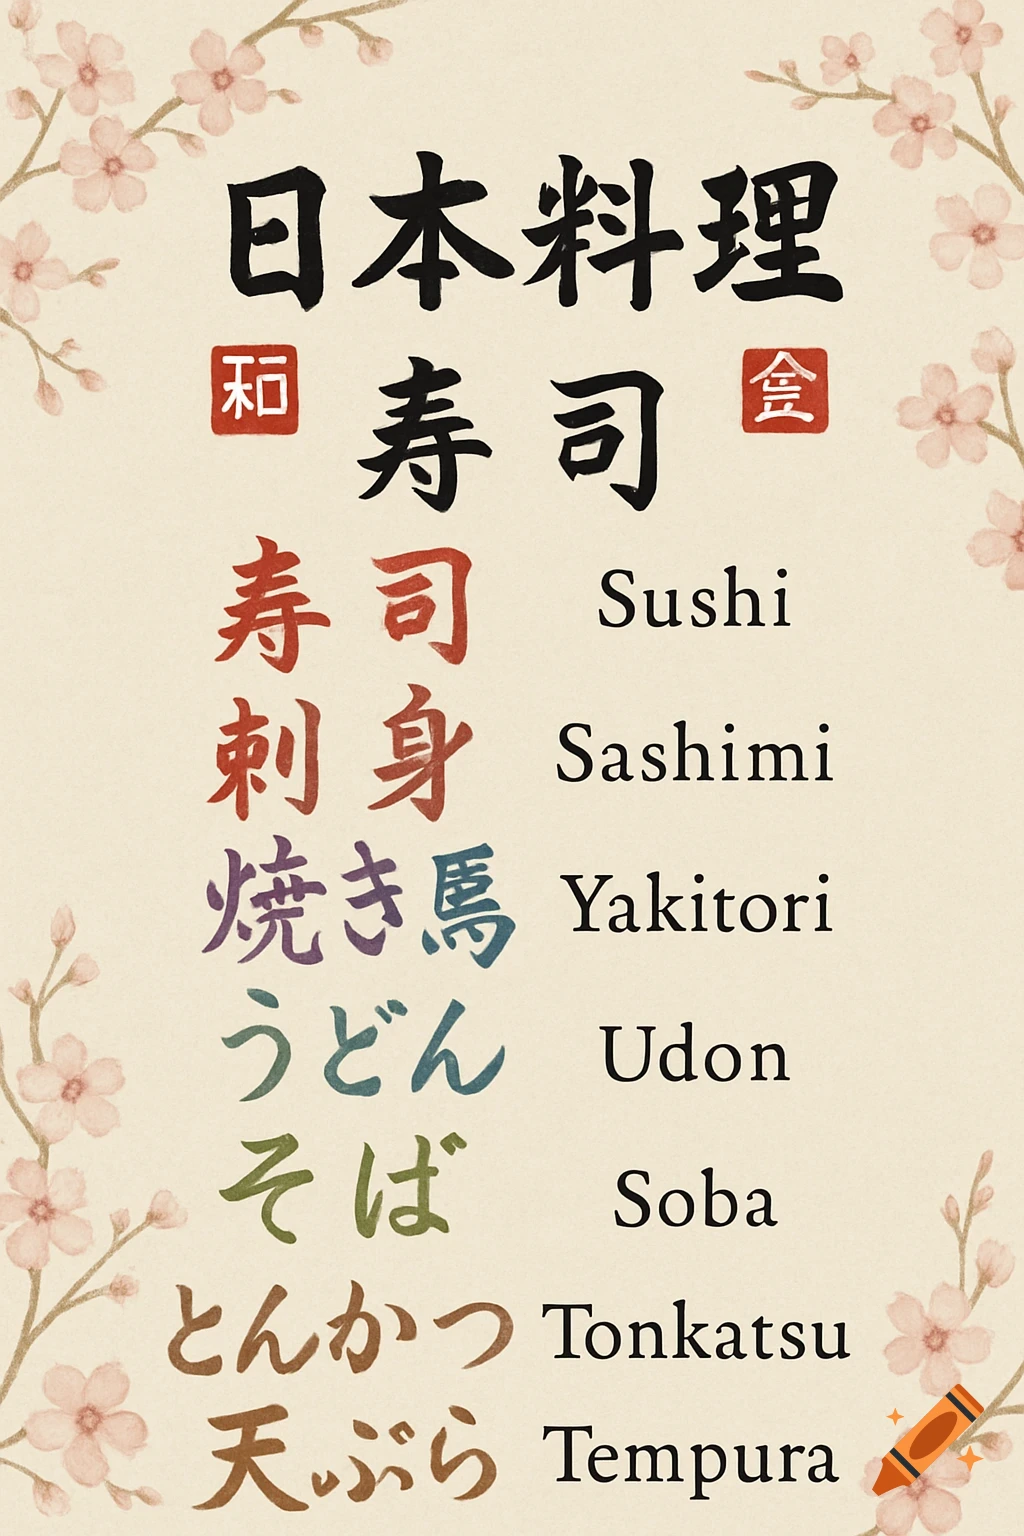
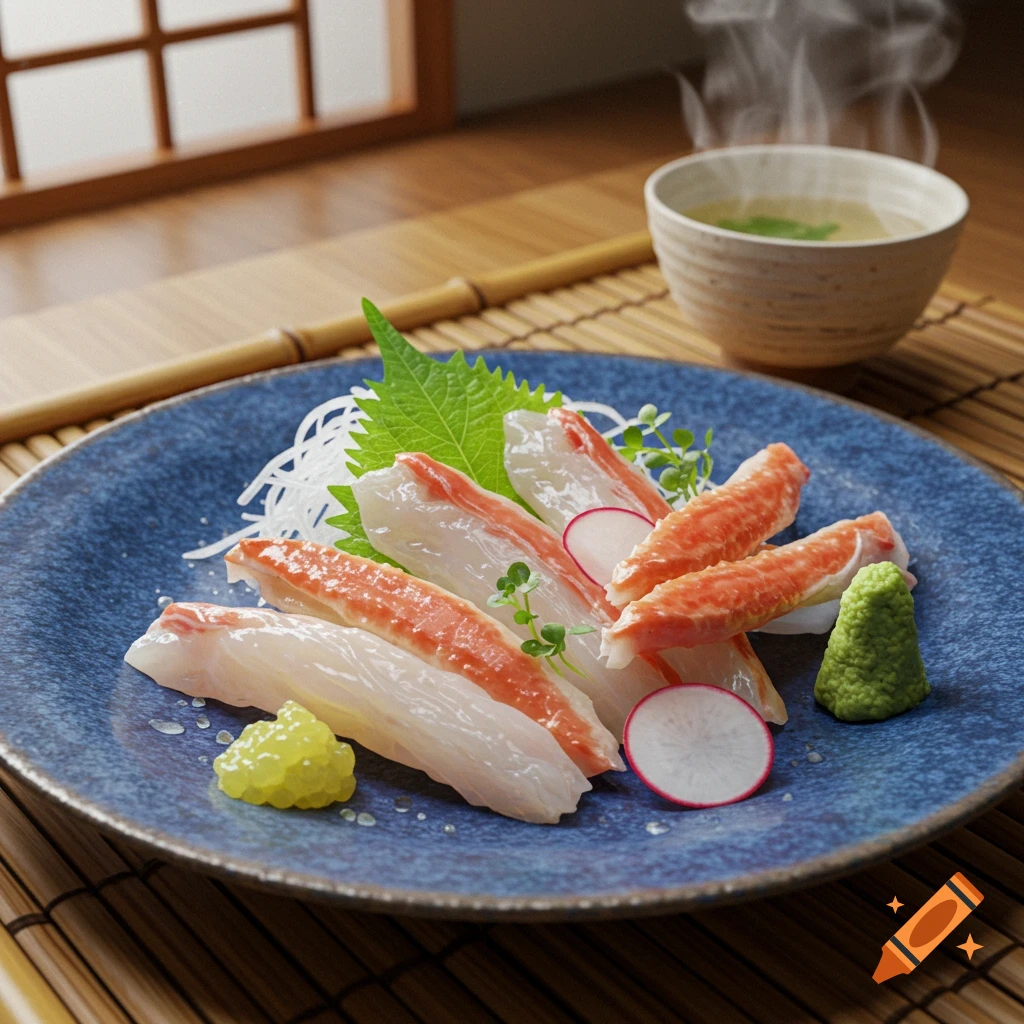
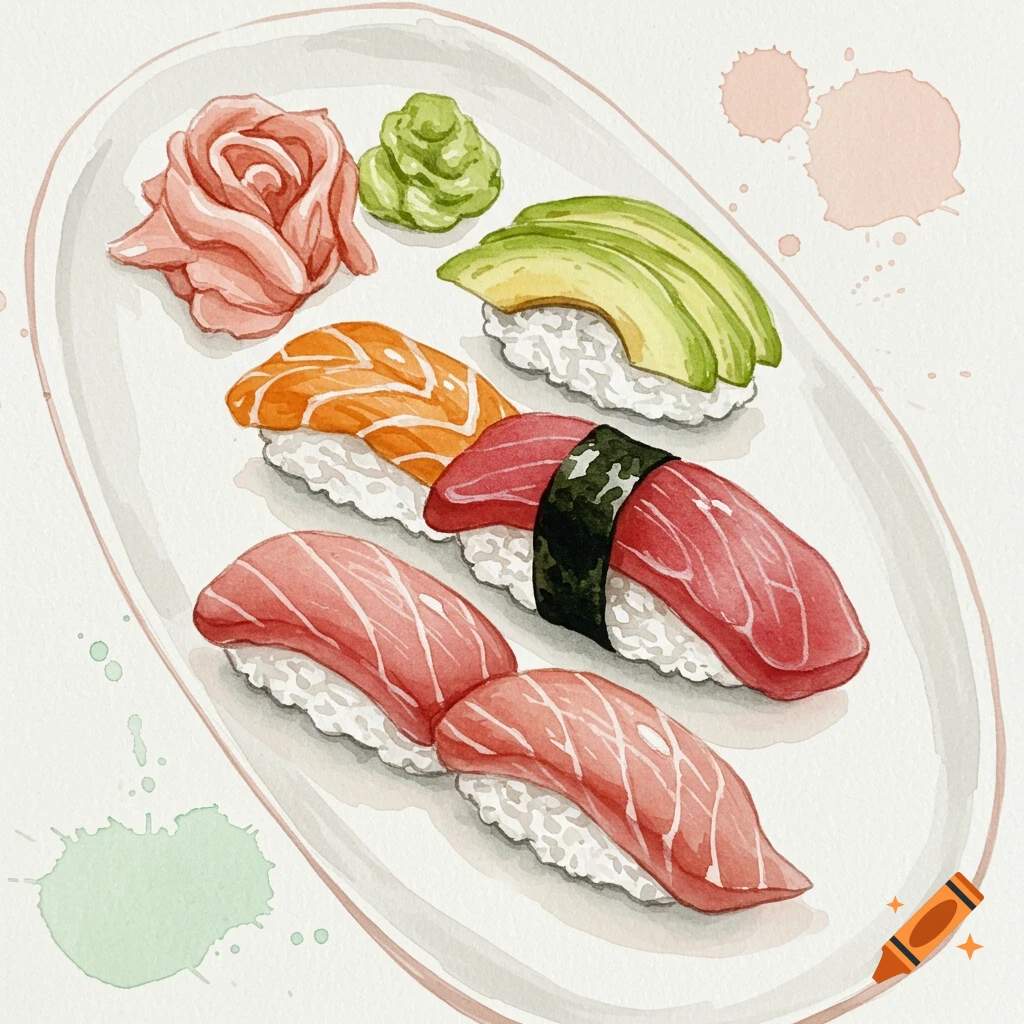
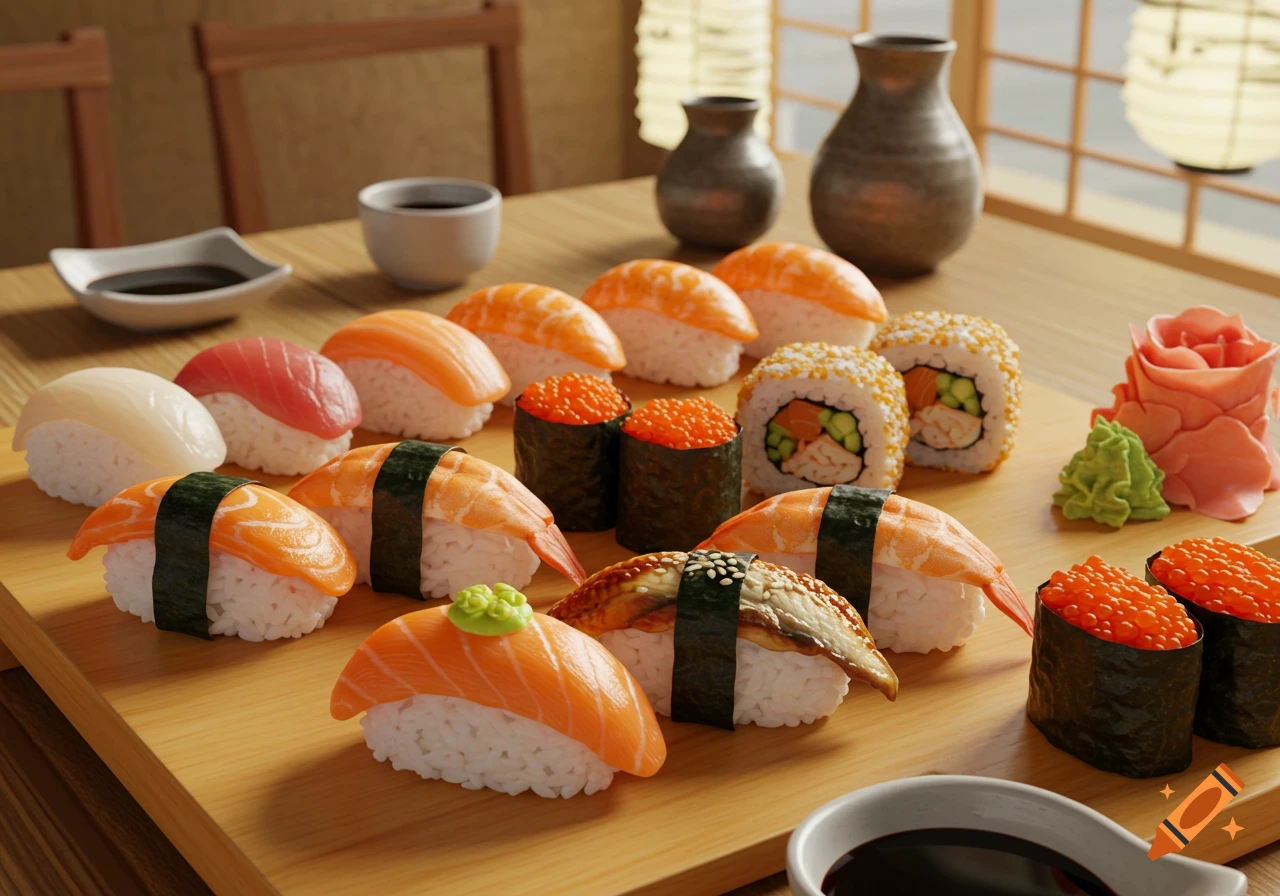
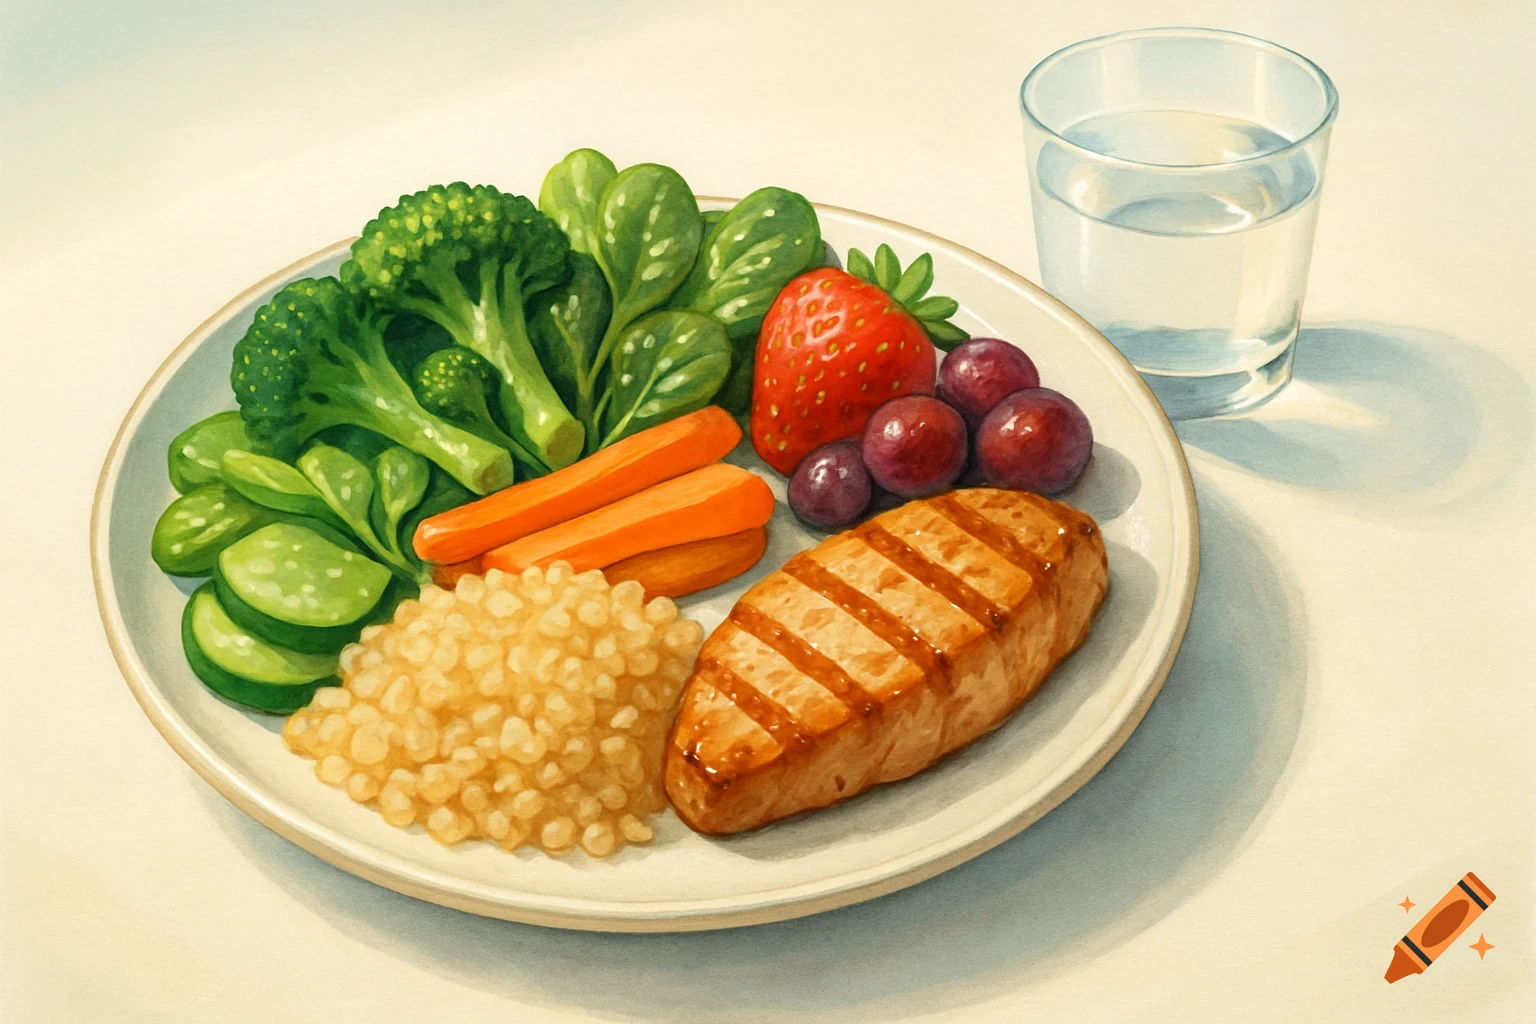
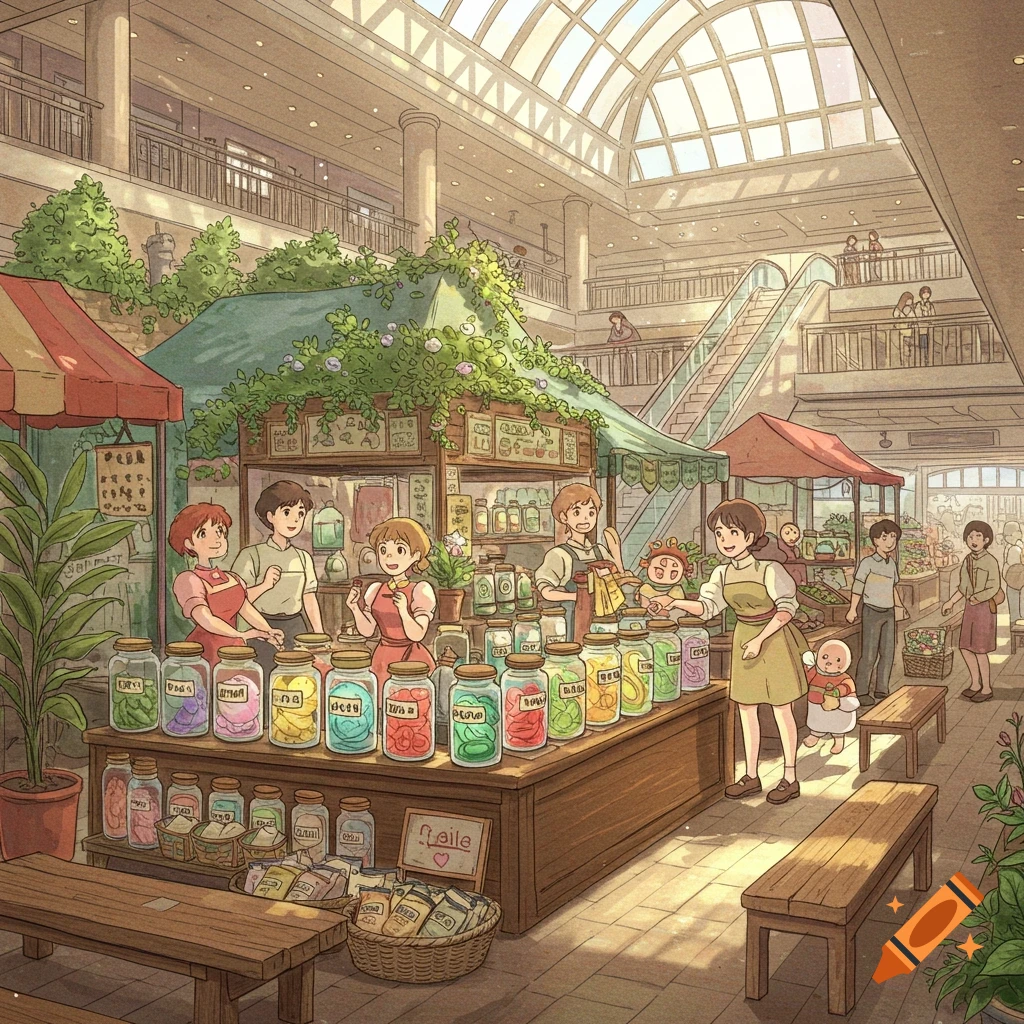
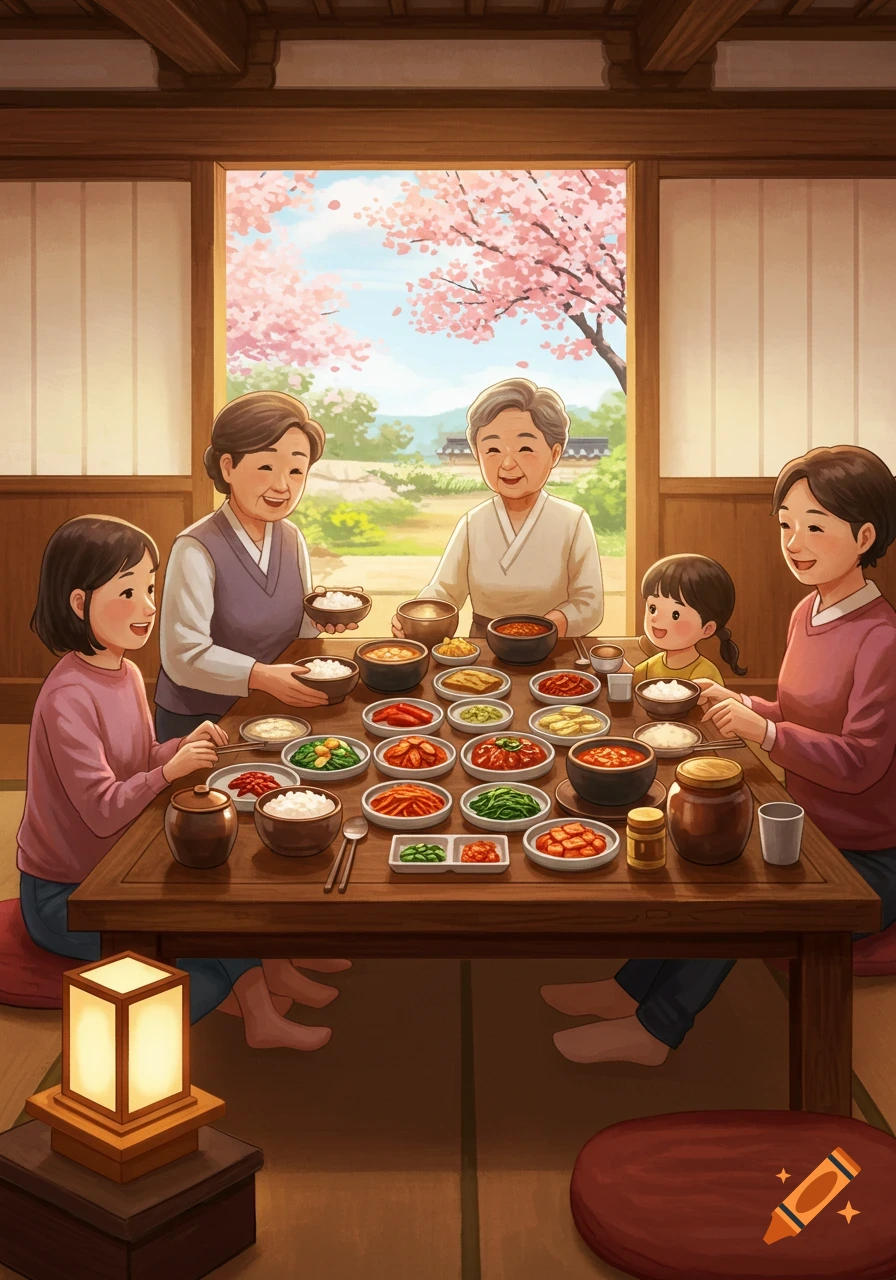
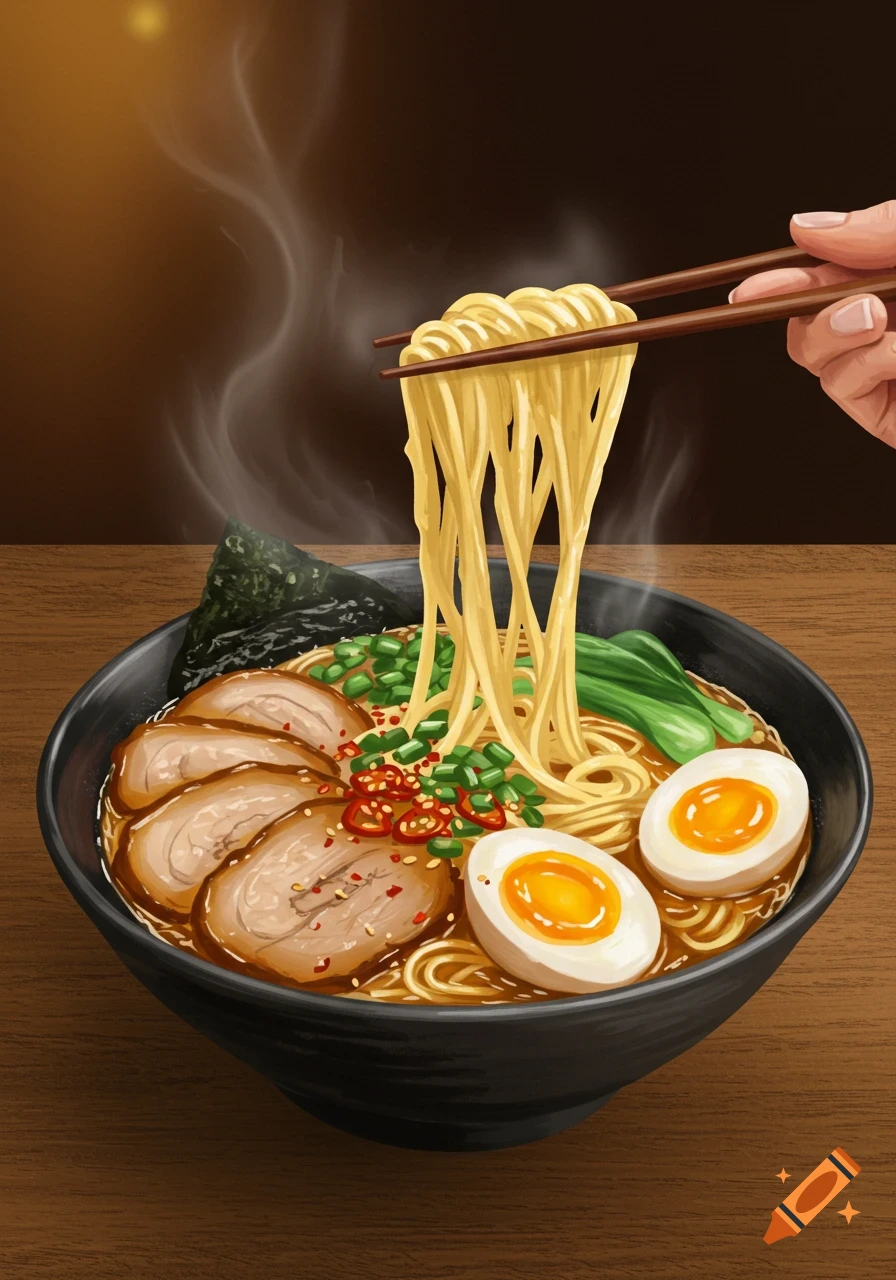
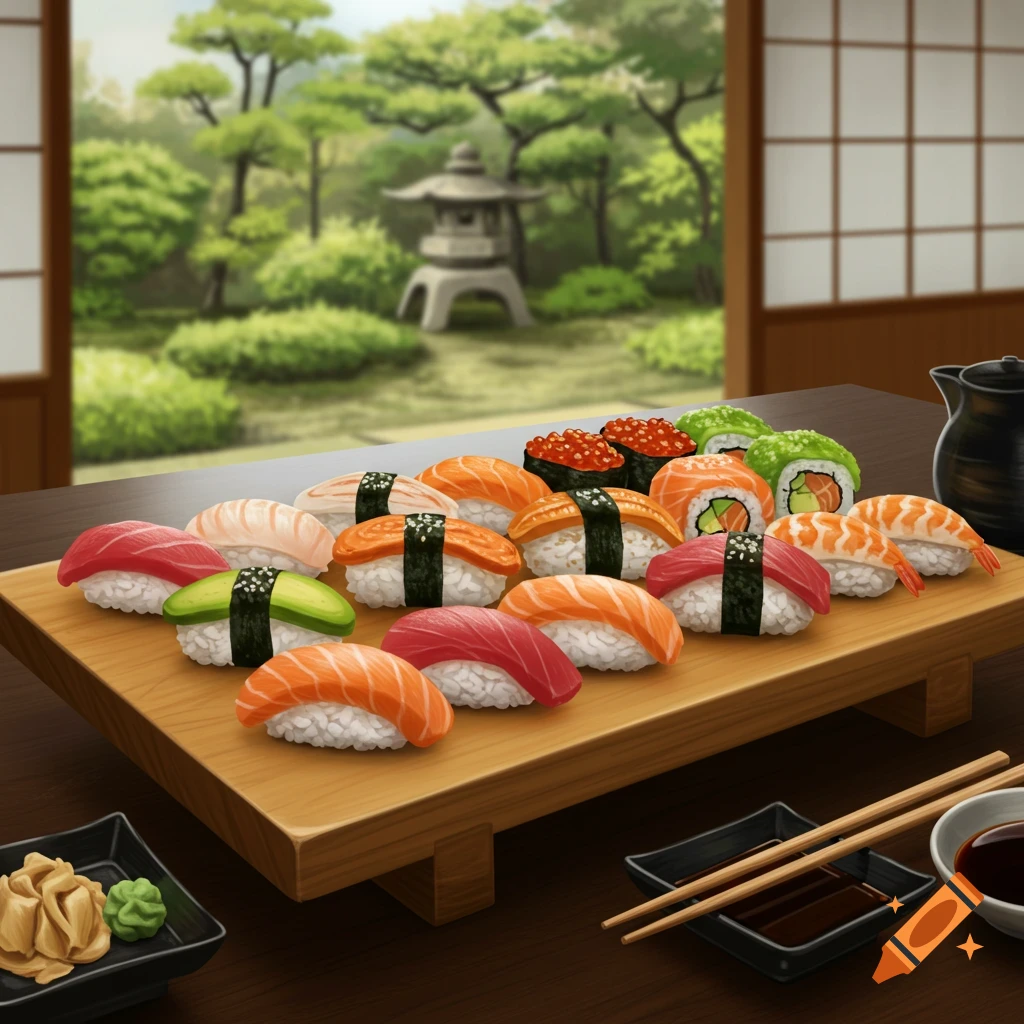
Illustrated seasonal food chart of Hakusan featuring various fruits, vegetables, fish, and meats divided into four seasons.

import os import matplotlib.pyplot as plt # Initialize a 2x2 grid for the four seasons fig, axs = plt.subplots(2, 2, figsize=(12, 10)) fig.suptitle('白山市の旬の食材 (Seasonal Foods of Hakusan)', fontsize=18, fontweight='bold', pad=20) # Define the seasonal food data verified for Hakusan City seasons = { "春 (Spring)": [ "・アスパラガス (Asparagus)", "・たけのこ / 山菜 (Bamboo shoots / Wild plants)", "・春いちご (Spring Strawberries)", "・渓流イワナ・ヤマメ (River Trout)" ], "夏 (Summer)": [ "・松任キュウリ (Matto Cucumber)", "・まっとうトマト / 金時草 (Tomato / Kinziso)", "・松任メロン / スイカ (Melon / Watermelon)", "・手取川のアゆ / 生しらす (Ayu / Raw Whitebait)" ], "秋 (Autumn)": [ "・白山丸いも (Hakusan Maruimo Yam)", "・白山なめこ / キノコ類 (Nameko / Mushrooms)", "・松任梨 / 栗 (Matto Pear / Chestnut)", "・加能ガニ / 香箱ガニ / のどぐろ (Local Crabs & Sea Bass)" ], "冬 (Winter)": [ "・源助だいこん / 寒野菜 (Radish / Winter Vegetables)", "・白山ジビエ (猪・熊) (Wild Boar & Bear Meat)", "・寒ブリ / ふぐ類 (Winter Yellowtail & Pufferfish)", "・堅豆腐 (伝統保存食) (Hard Tofu - Traditional Food)" ] } # Aesthetic color palette for each season colors = ['#ebf7ee', '#fef9e7', '#fdf2e9', '#f4f6f7'] edge_colors = ['#2e7d32', '#f39c12', '#d35400', '#34495e'] # Plot each season into its respective quadrant for ax, (season, items), color, edge_color in zip(axs.flat, seasons.items(), colors, edge_colors): ax.set_facecolor(color) ax.text(0.5, 0.85, season, fontsize=14, fontweight='bold', ha='center', va='center', color=edge_color) y_pos = 0.65 for item in items: ax.text(0.5, y_pos, item, fontsize=11, ha='center', va='center') Ver mais
More images like this