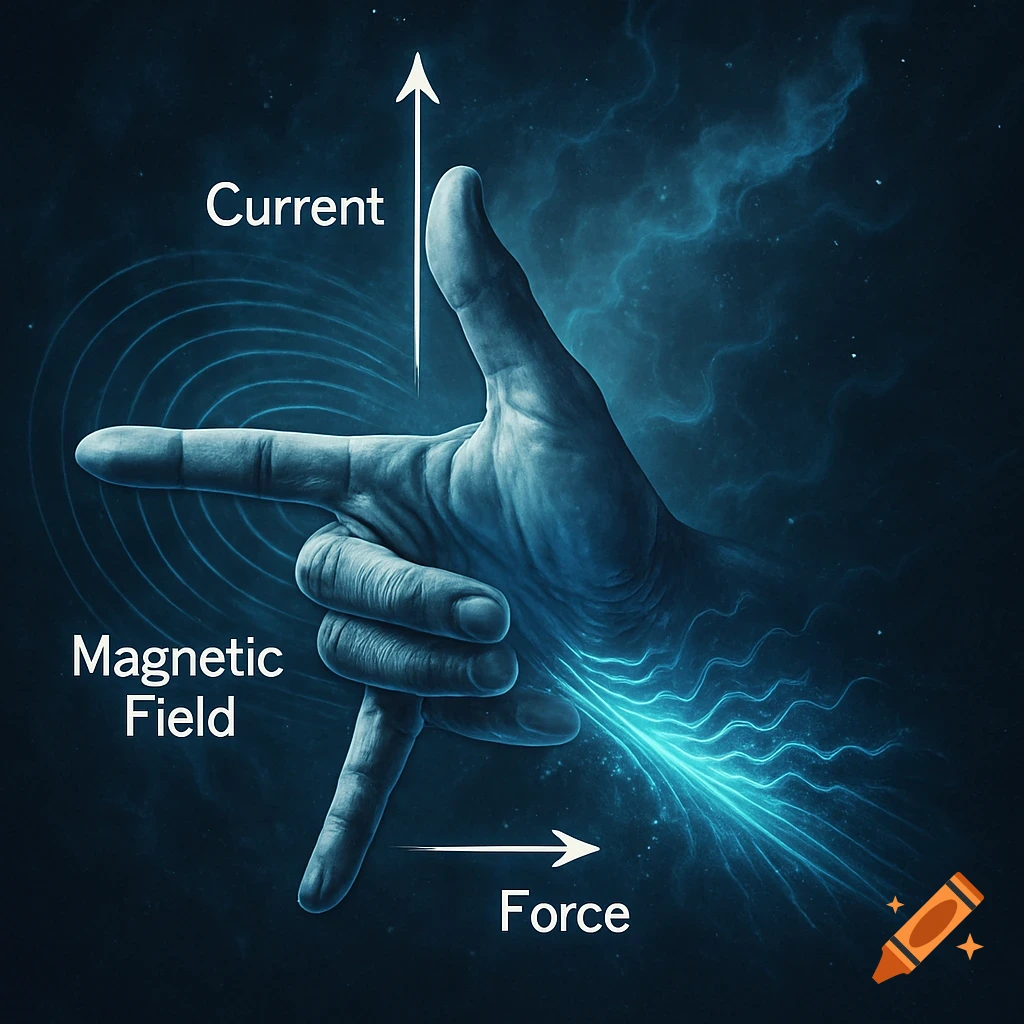
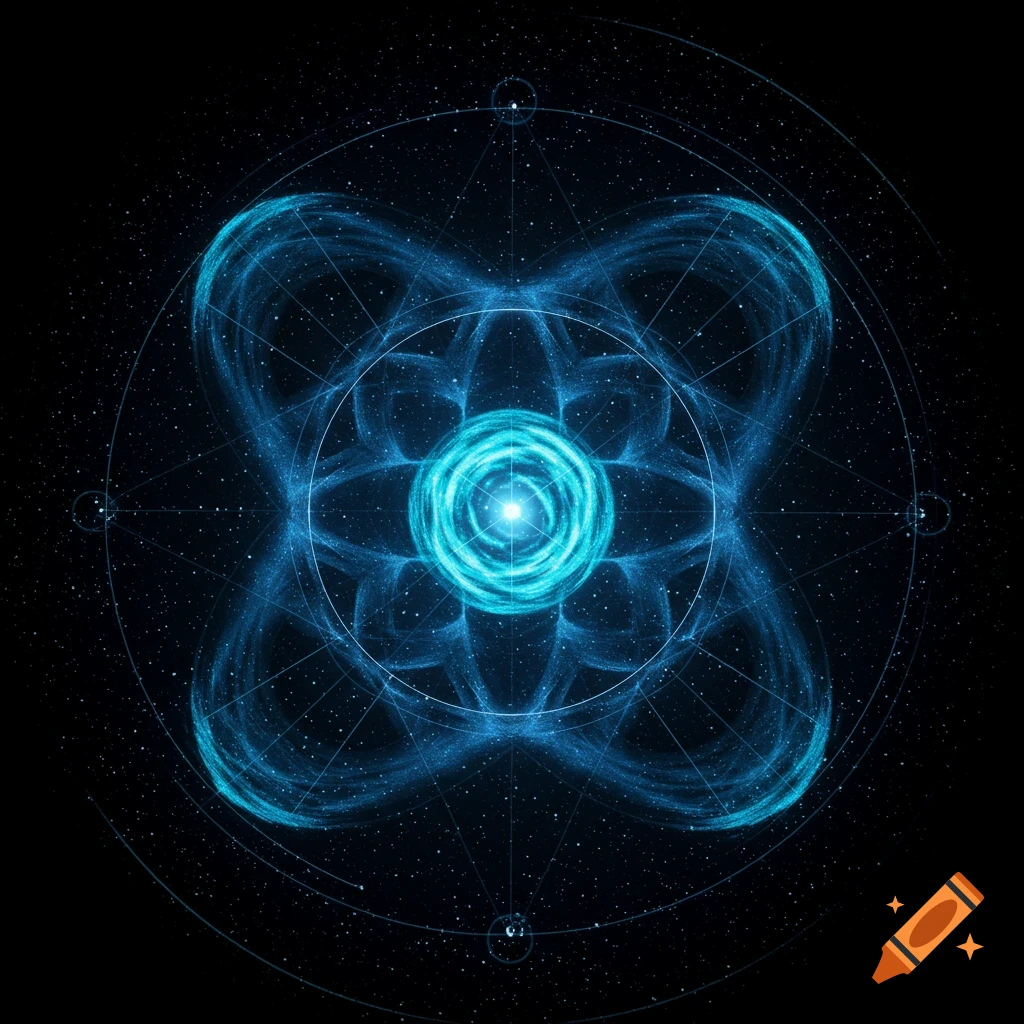
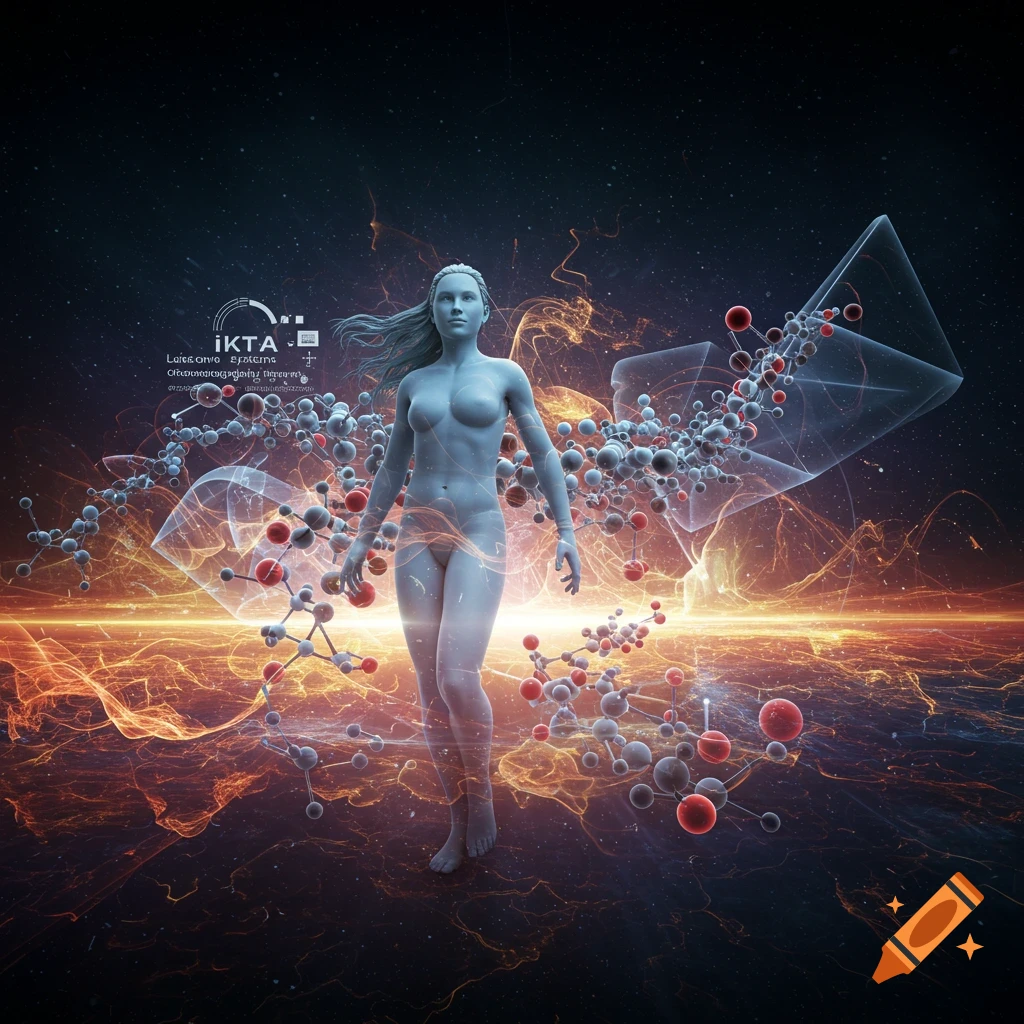
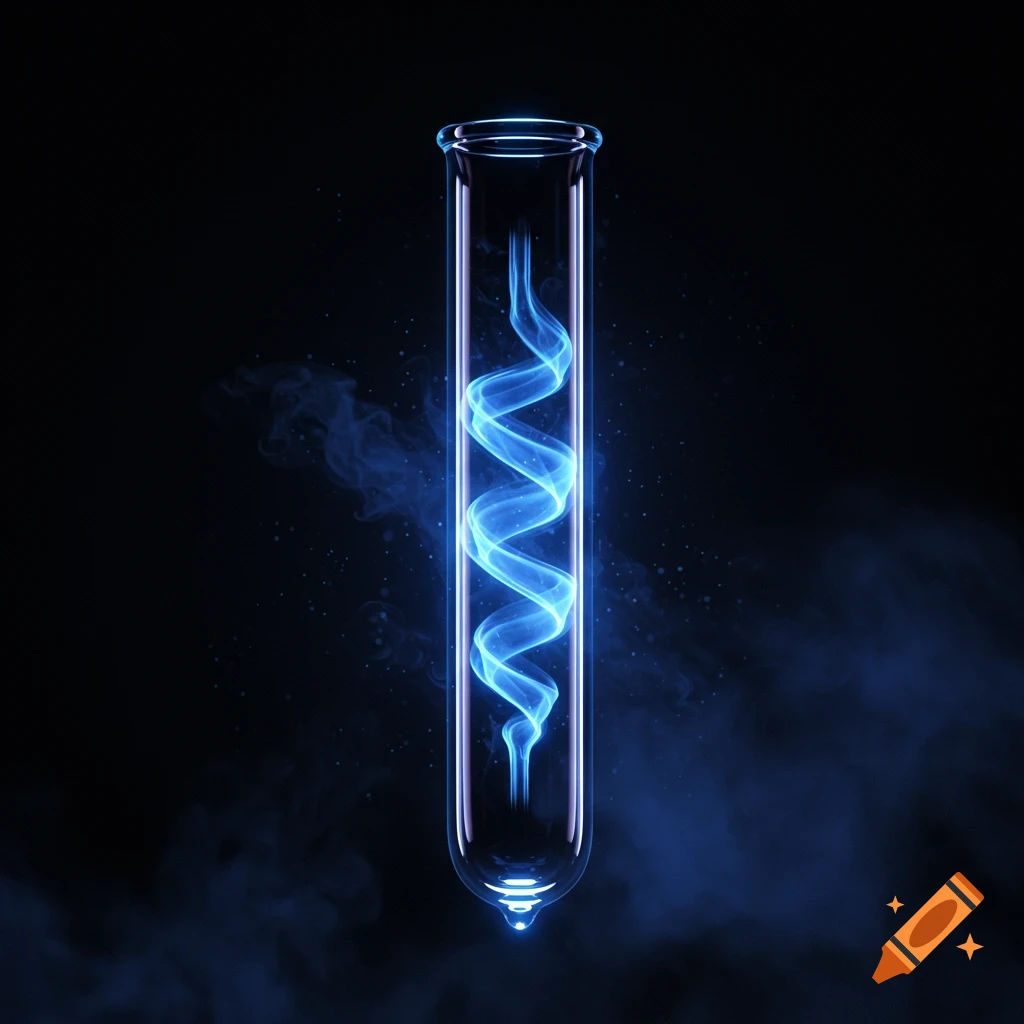
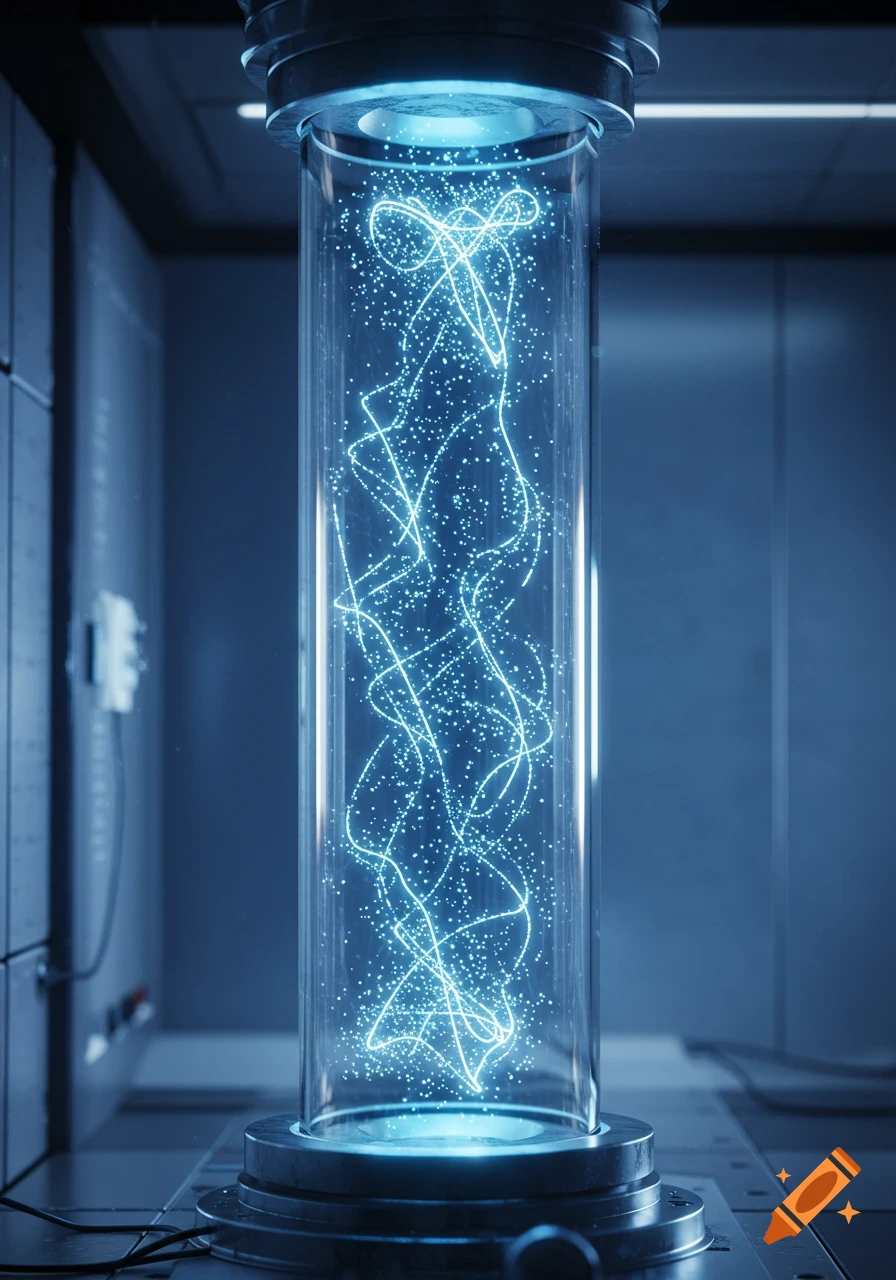
A professional scientific infographic on cold atom interferometry with a central vertical tube showing atomic phase and laser beams over a subtle world map. Listed research centers are shown below.

Create a professional 1:1 scientific infographic for LinkedIn titled: “COLD ATOM INTERFEROMETRY — THE NEXT STEP IN PRECISION POSITIONING” Subtitle: “From measuring phase to measuring motion” Visual style: High-end scientific visualization, modern geodesy and navigation technology, dark navy/black background, elegant cyan, white and subtle gold accents. Clean, sophisticated, technically credible, suitable for professional surveyors, geodesists, navigation engineers and reality-capture professionals. MAIN VISUAL: Show a cold-atom interferometer in the center. Visualize a cloud of ultra-cold atoms falling vertically through three precisely aligned laser pulses. Show the laser beams as thin luminous horizontal beams crossing the atom cloud. Show the atom trajectories splitting and recombining, creating an interference pattern. Visually communicate that the measured atomic phase contains information about motion. Create a clear conceptual flow: ATOMIC PHASE ↓ ACCELERATION / GRAVITY / ROTATION ↓ PRECISION INERTIAL MEASUREMENT ↓ NAVIGATION & POSITIONING Include subtle visual references to gravity, acceleration, rotation and navigation. BACKGROUND: Use a subtle world map silhouette, almost transparent, behind the scientific visualization. On the lower portion of the infographic, create a clean horizontal timeline labeled: “SELECTED RESEARCH CENTERS / PROGRAMS” Highlight these countries with small glowing location markers: France Germany, Greece, Italy, Mexico, India, New Zealand, Voir plus
More images like this