

'%3e%3cpath%20d='M12%2020.3333C16.6024%2020.3333%2020.3333%2016.6024%2020.3333%2012C20.3333%207.39762%2016.6024%203.66666%2012%203.66666C7.39763%203.66666%203.66667%207.39762%203.66667%2012C3.66667%2016.6024%207.39763%2020.3333%2012%2020.3333Z'%20stroke='%23F2F2F2'%20stroke-width='2.08333'%20stroke-linecap='round'%20stroke-linejoin='round'/%3e%3cpath%20d='M8.66667%2013.6667C8.66667%2013.6667%209.91667%2015.3333%2012%2015.3333C14.0833%2015.3333%2015.3333%2013.6667%2015.3333%2013.6667'%20stroke='%23F2F2F2'%20stroke-width='2.08333'%20stroke-linecap='round'%20stroke-linejoin='round'/%3e%3cpath%20d='M9.5%209.5H9.50833'%20stroke='%23F2F2F2'%20stroke-width='2.08333'%20stroke-linecap='round'%20stroke-linejoin='round'/%3e%3cpath%20d='M14.5%209.5H14.5083'%20stroke='%23F2F2F2'%20stroke-width='2.08333'%20stroke-linecap='round'%20stroke-linejoin='round'/%3e%3c/g%3e%3cdefs%3e%3cclipPath%20id='clip0_10282_1064'%3e%3crect%20width='20'%20height='20'%20fill='white'%20transform='translate(2%202)'/%3e%3c/clipPath%3e%3c/defs%3e%3c/svg%3e)


A market phases chart showing price action and volume bars across Accumulation, Markup, Distribution, and Markdown stages.
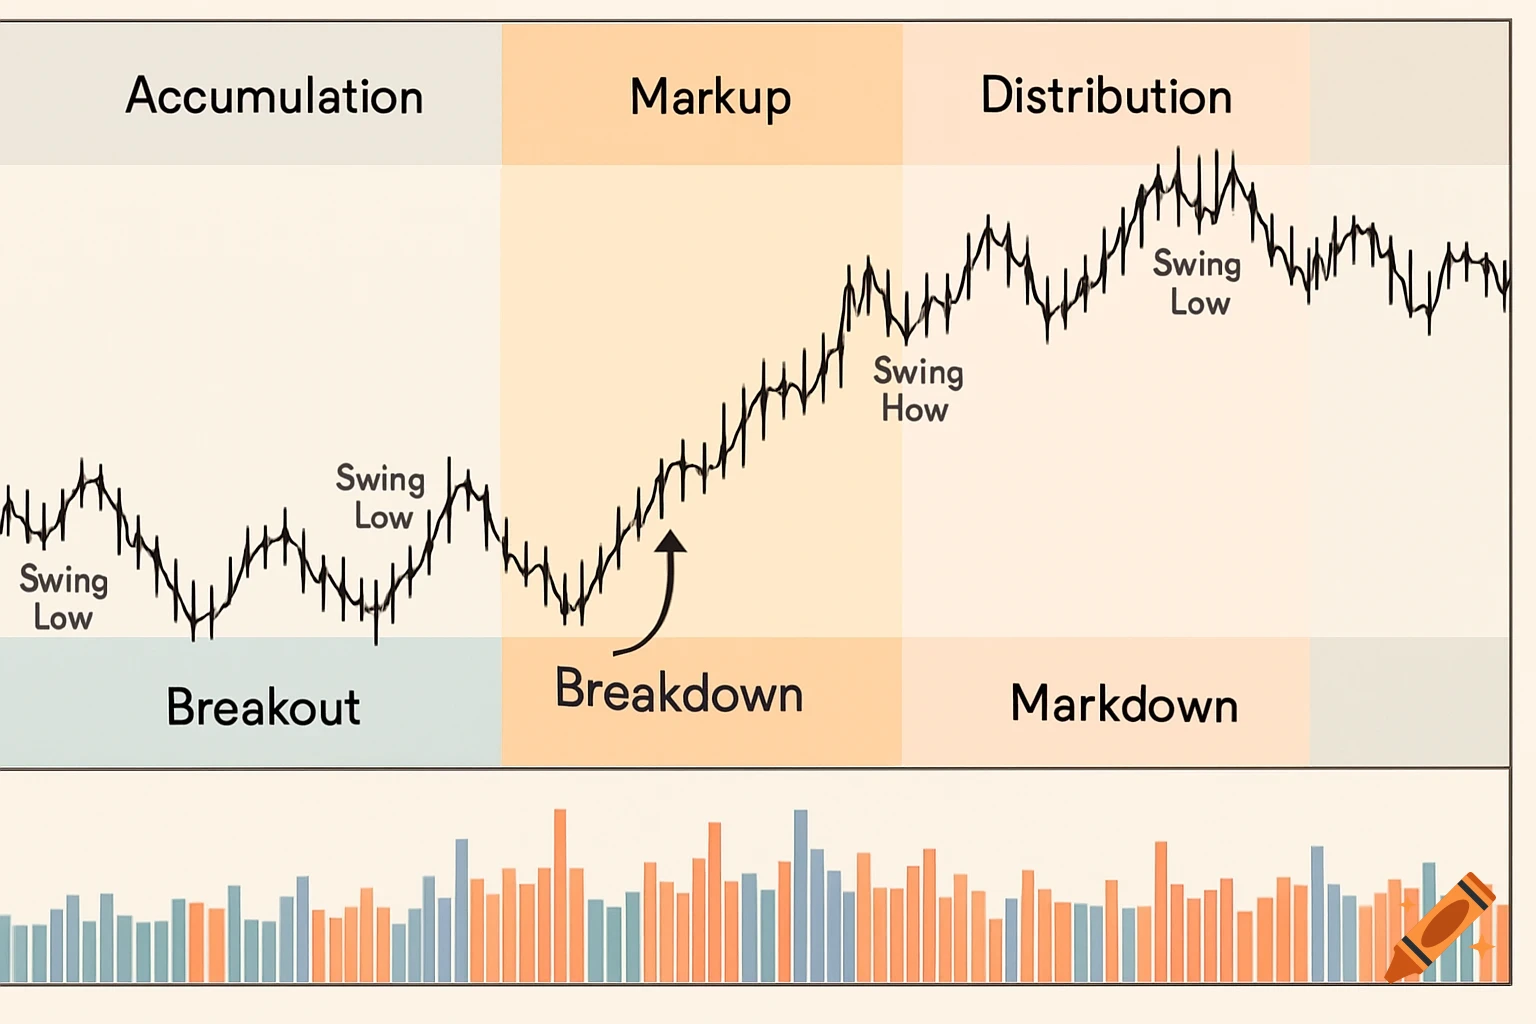
1. Market Phases Chart Description: A multi-panel time series chart showing the four market phases—Accumulation, Markup, Distribution, and Markdown—in a single price chart of a forex pair. Each phase is color-coded and annotated with volume bars below showing rising or falling volume trends corresponding to each phase. Visual Features: • Horizontal colored bands or brackets indicating each phase. • Price plotted with clear swing highs/lows showing range in Accumulation and Distribution. • Volume bars with volume spikes highlighted. • Arrows or text labels explaining phase transitions (e.g., breakout from Accumulation). Placement: Insert at the end of the chapter "Core Philosophy: Markets Move in Predictable Phases" as a comprehensive example to summarize the concept visually. See more
More images like this
