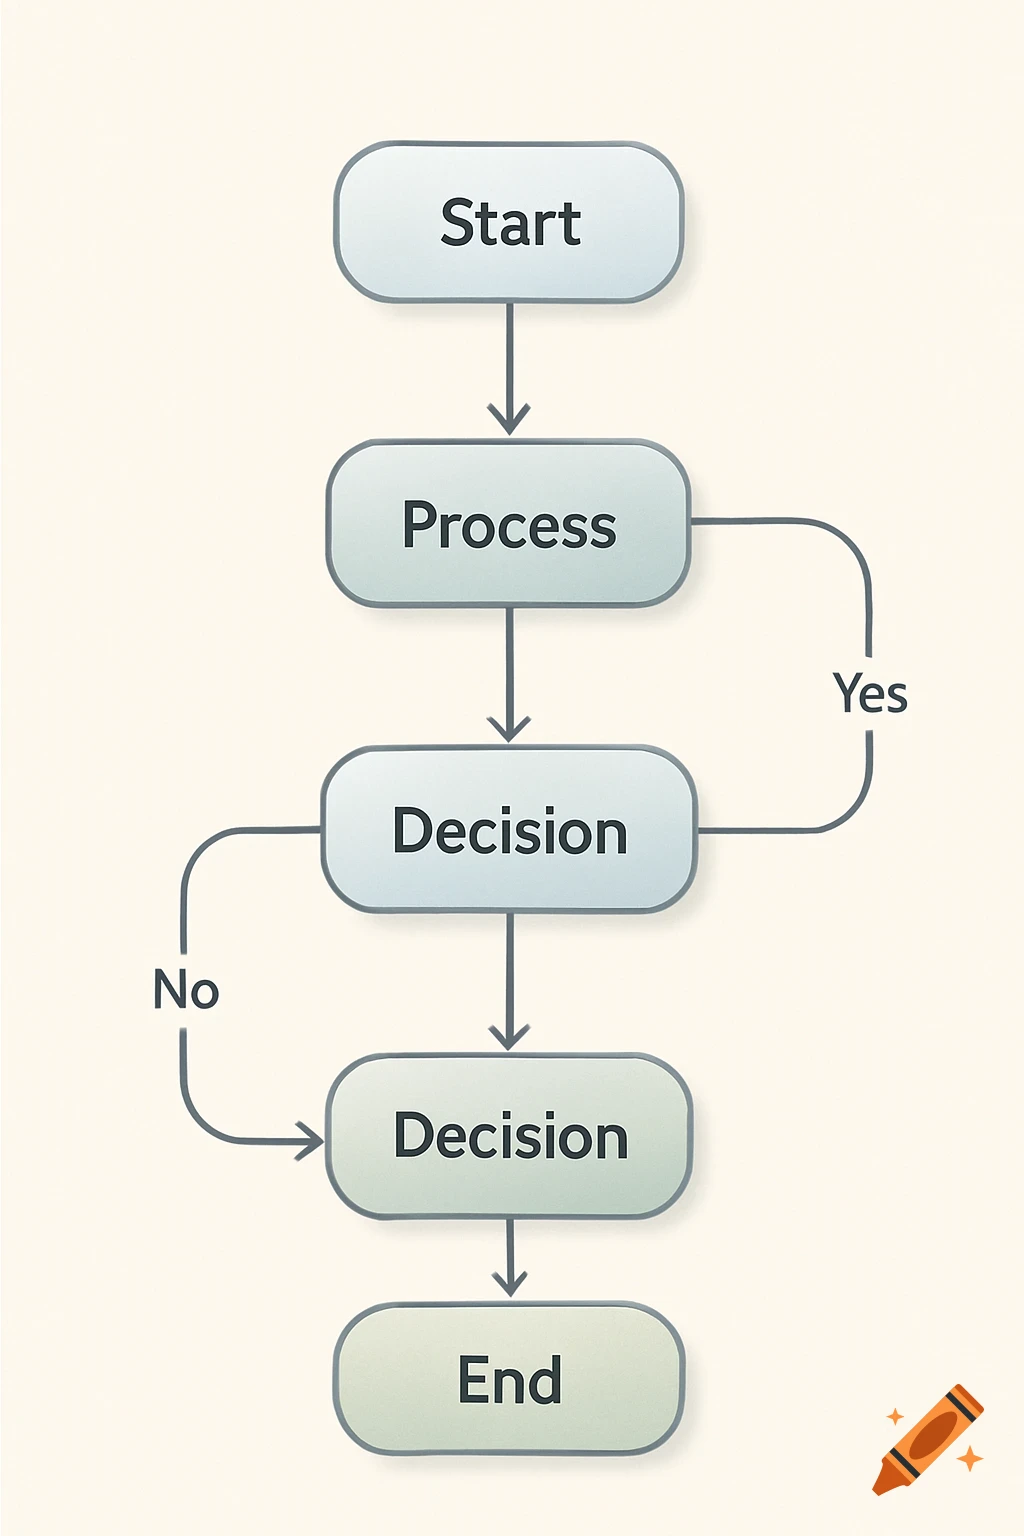
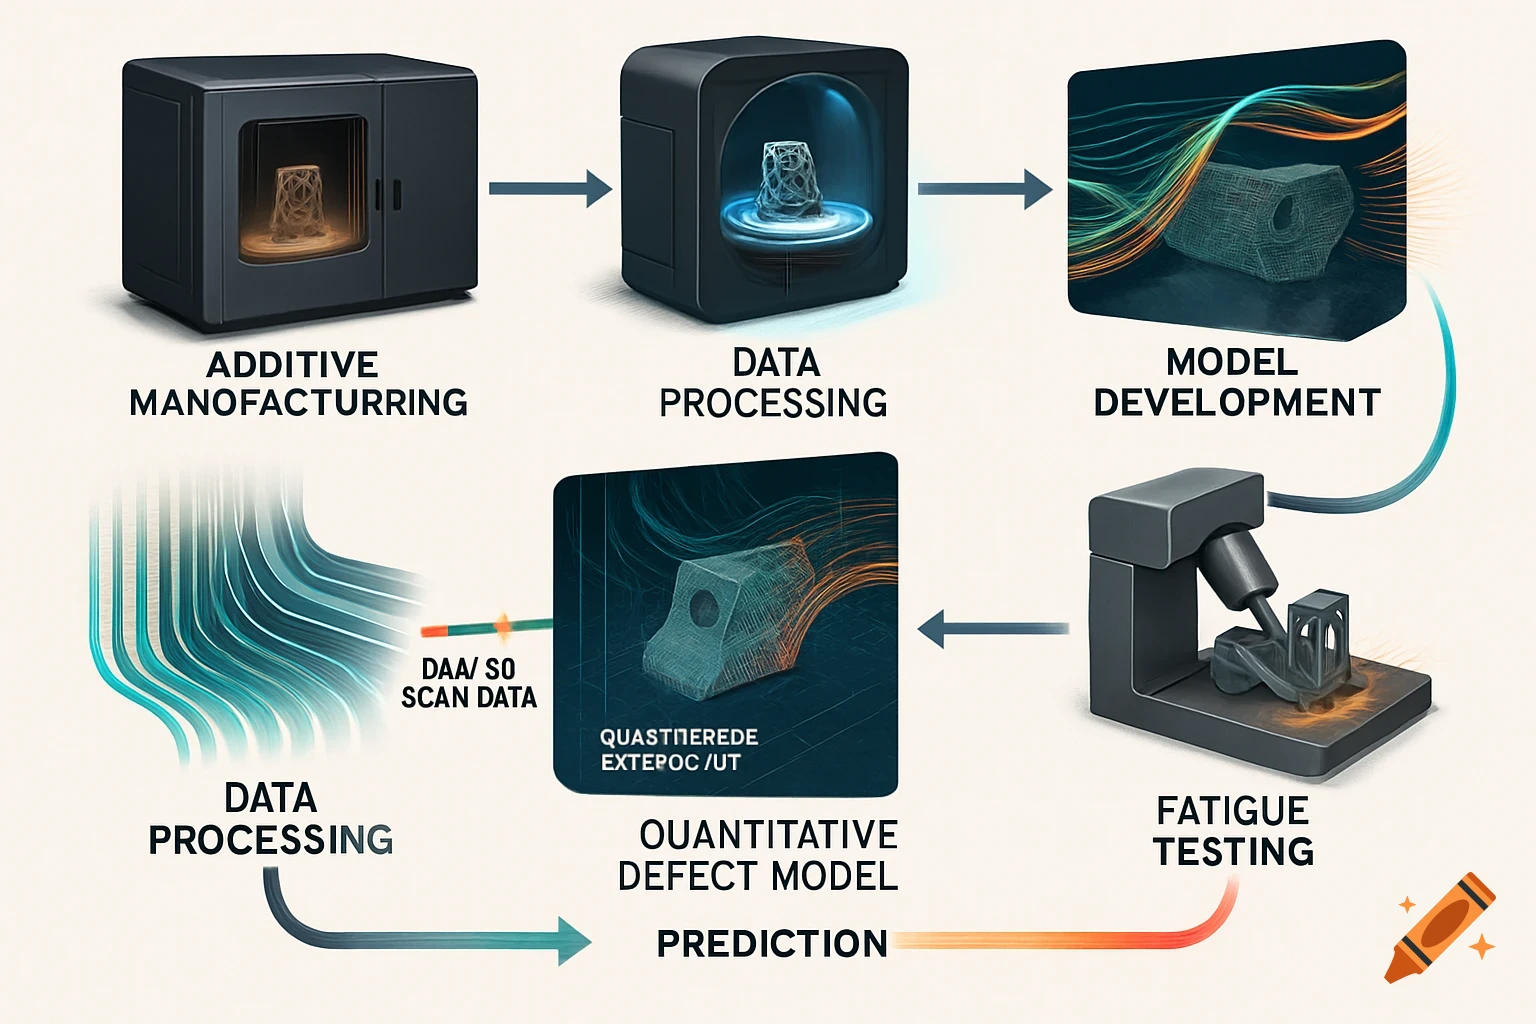
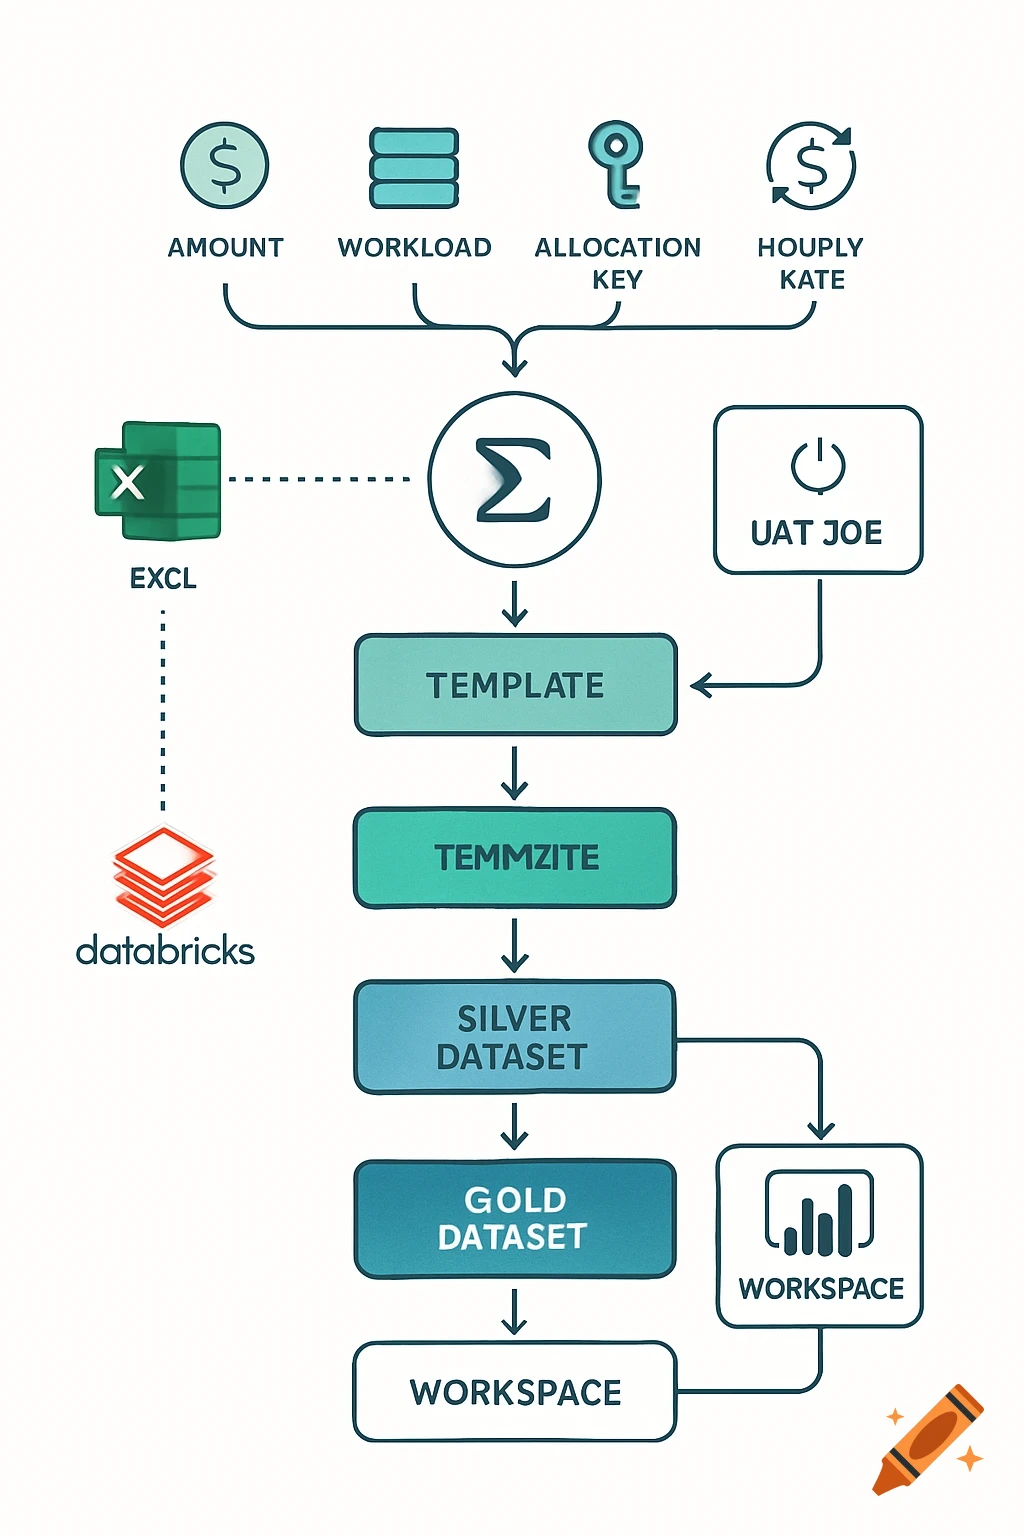
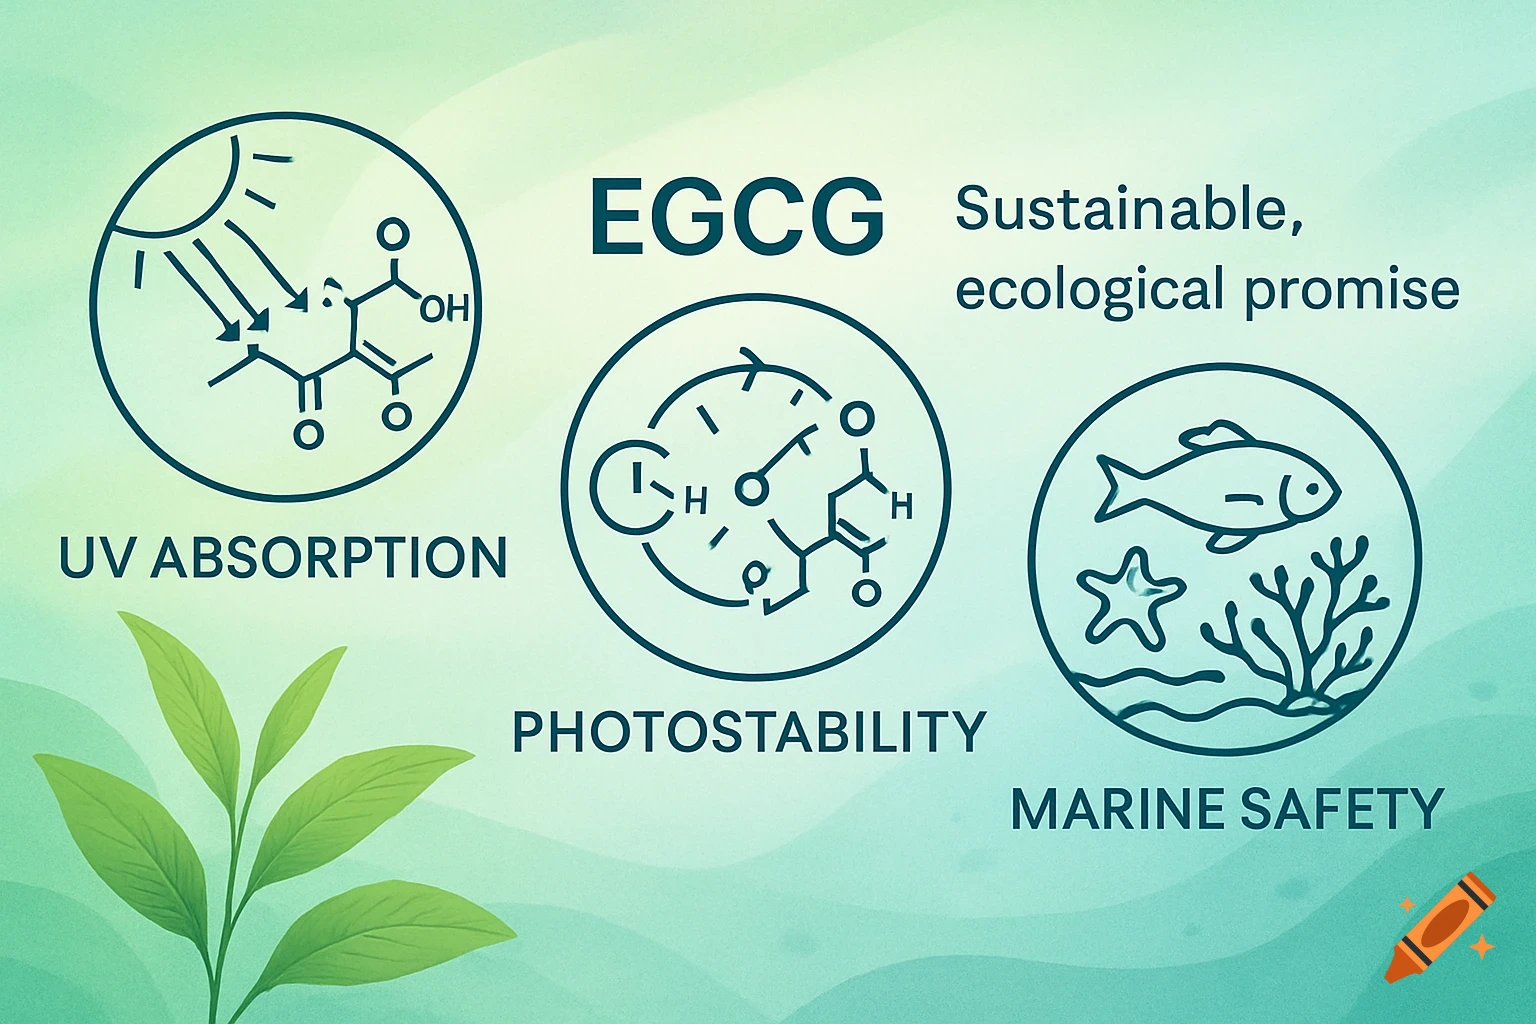
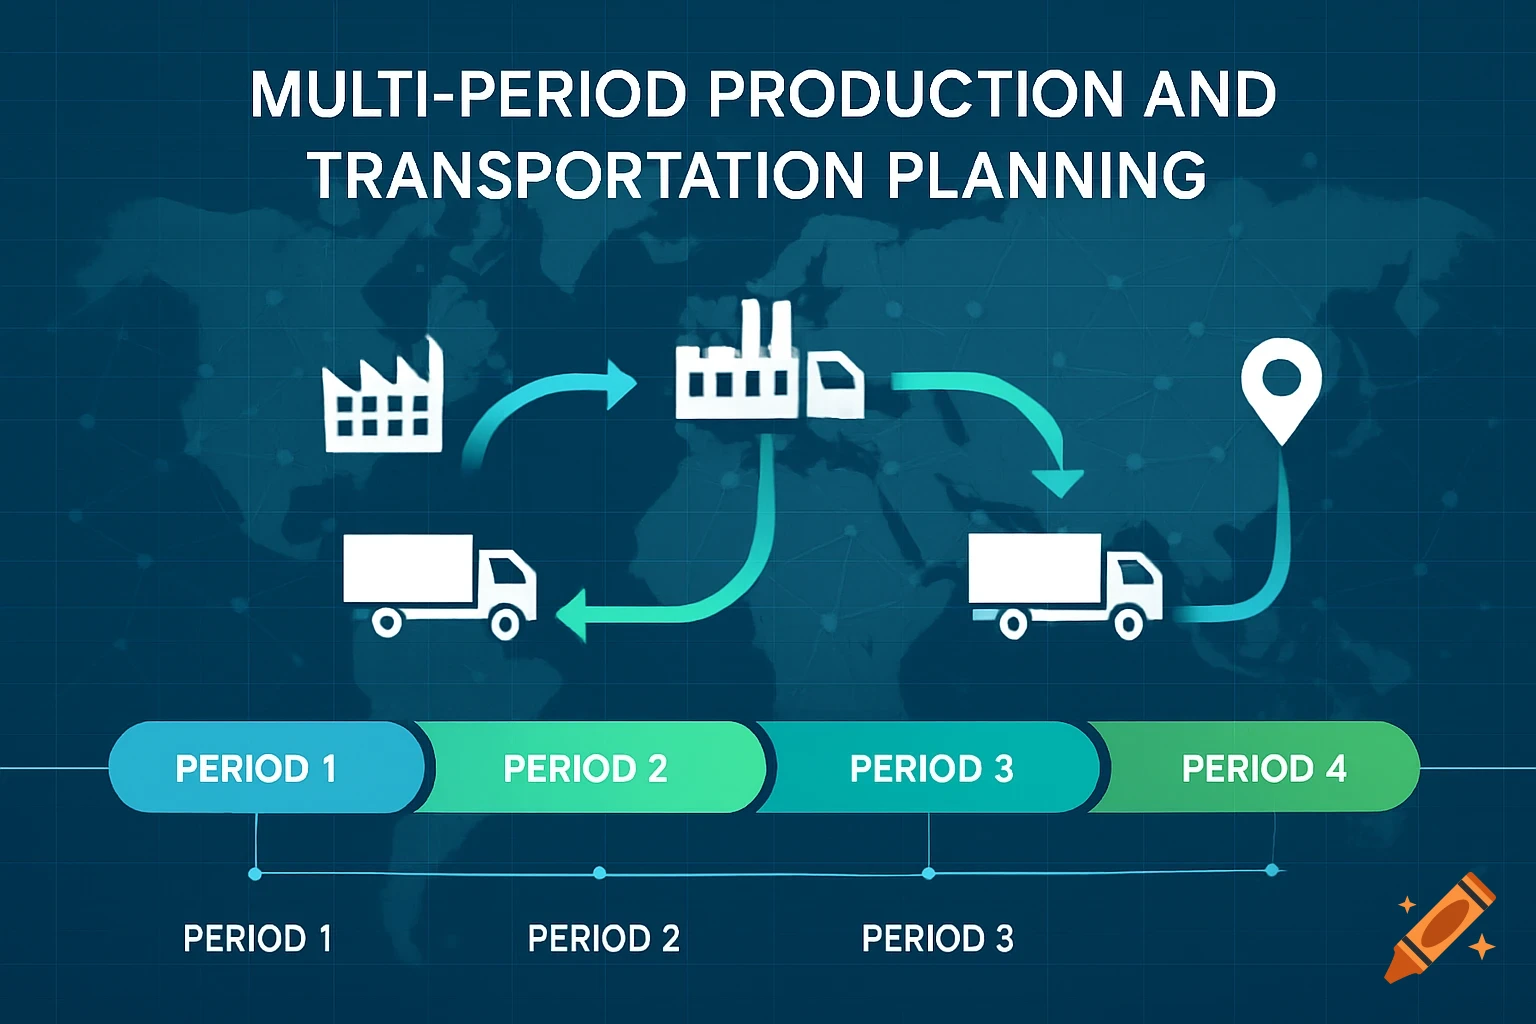
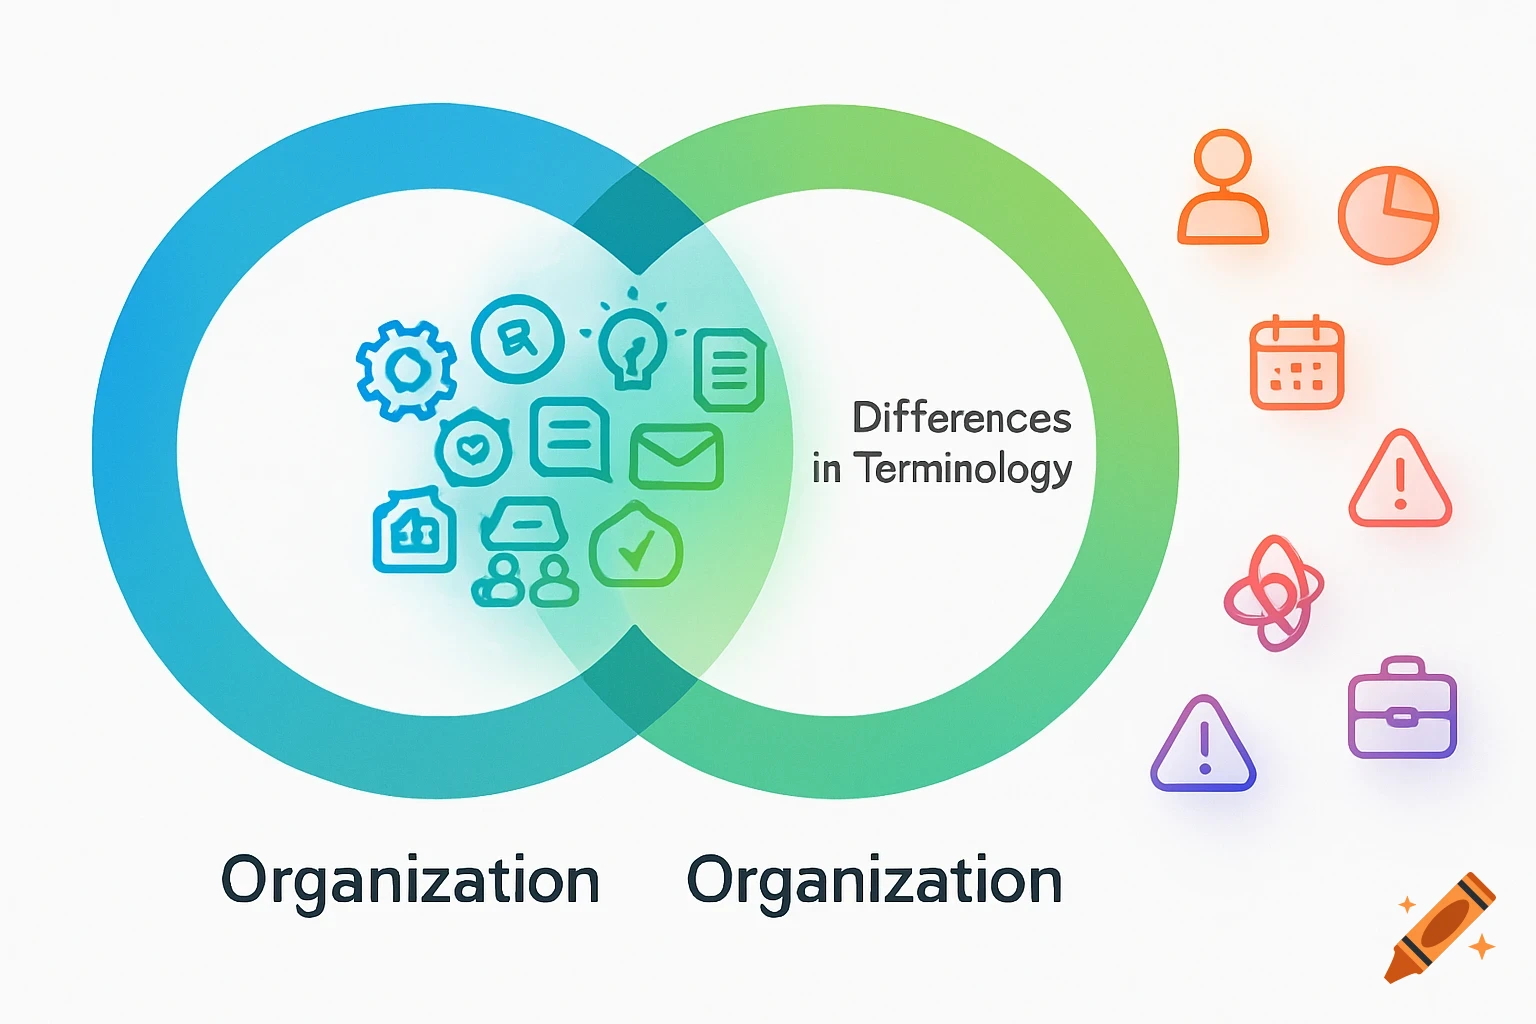
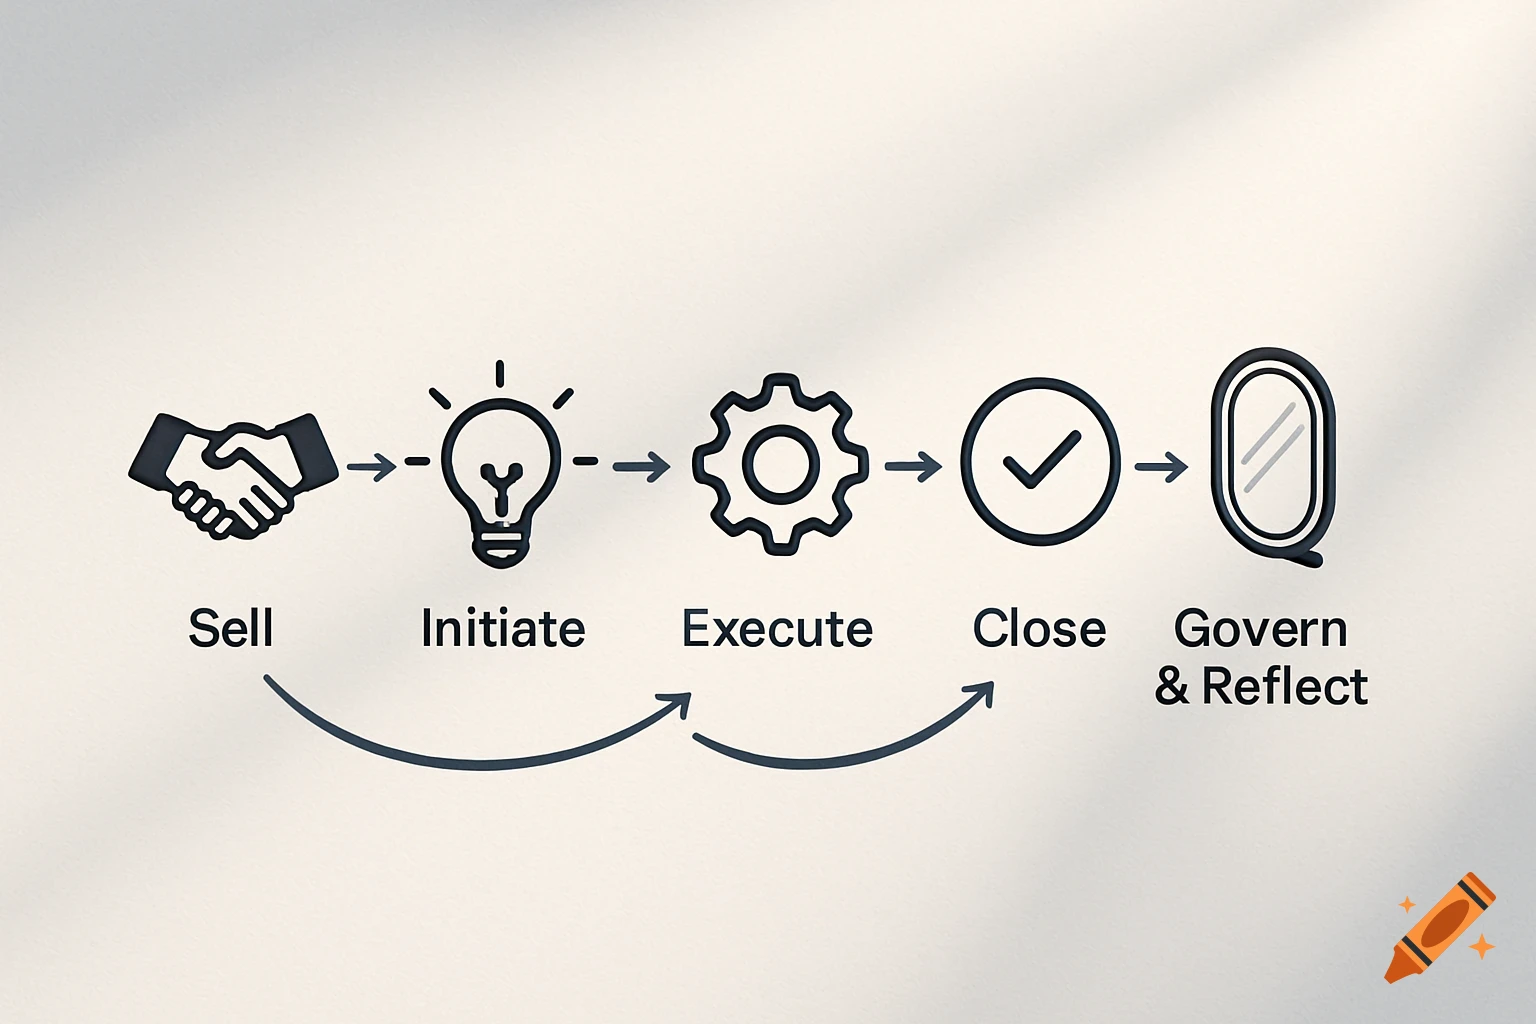
Minimalist horizontal flowchart illustrating steps from high residential cooling energy consumption to a sustainable smart building solution.

Minimalist clean horizontal flowchart infographic for an engineering presentation, isolated on a pure white background. The diagram visually represents energy systems logic using professional flat vector graphics. Flow steps transition from a box representing high residential cooling energy consumption, through a box for grid instability and diesel emissions, leading to a box for carbon footprint, and concluding with a distinct eco-green box for a sustainable smart building solution. Clean soft gray boxes, smooth muted blue connecting arrows, elegant typography placeholders, zero text clutter, highly scannable, academic standard. Ver mais
More images like this