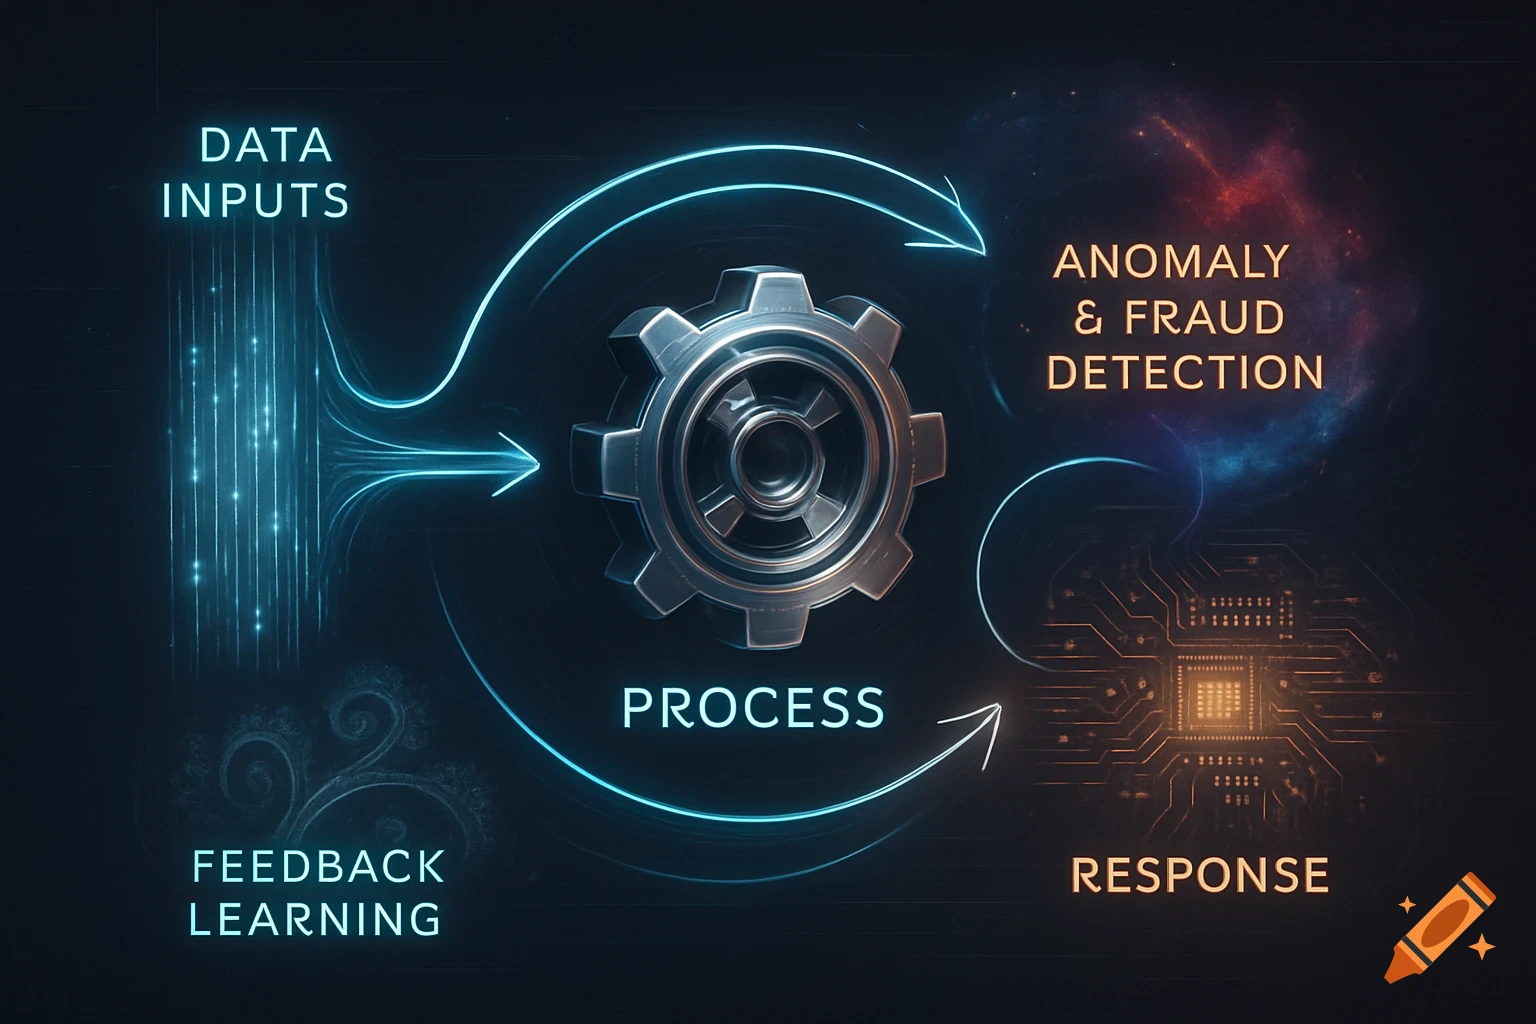
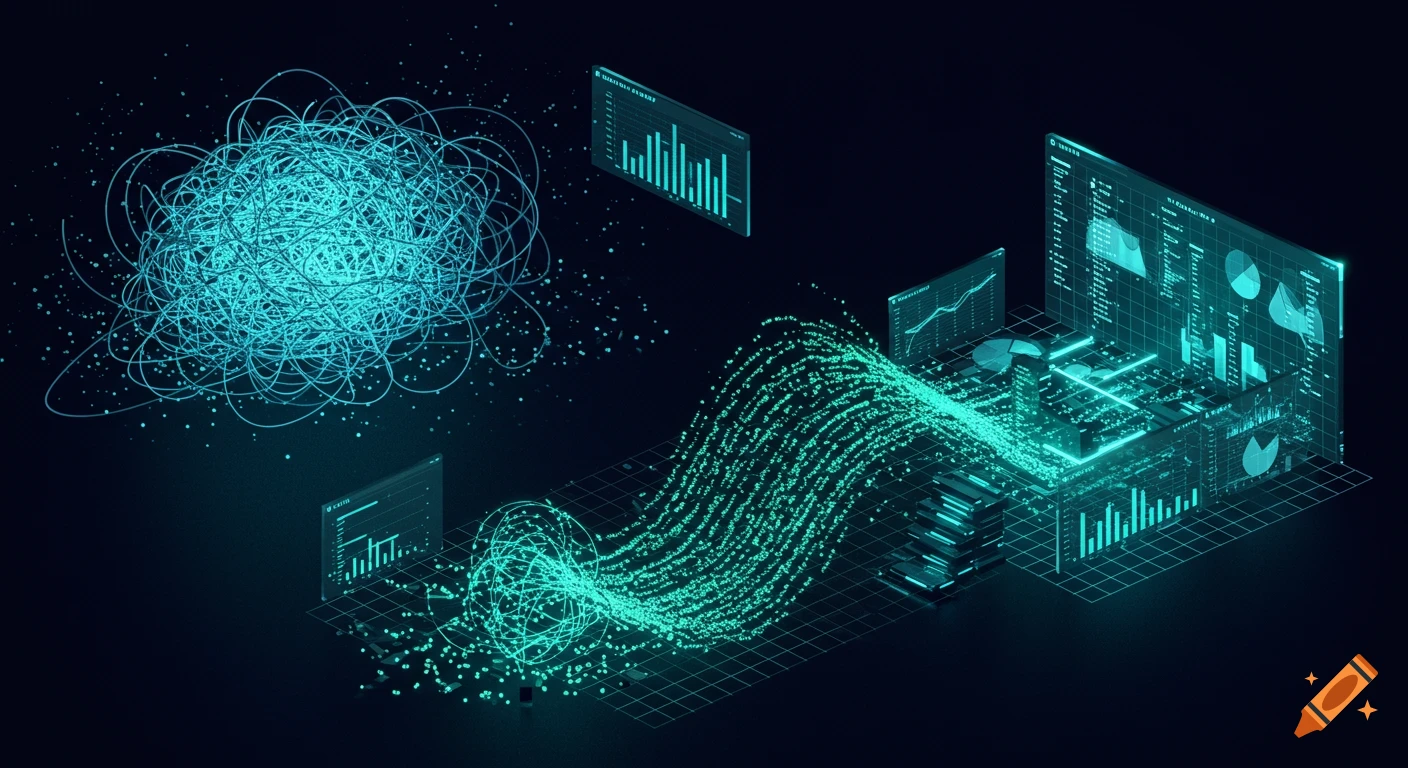
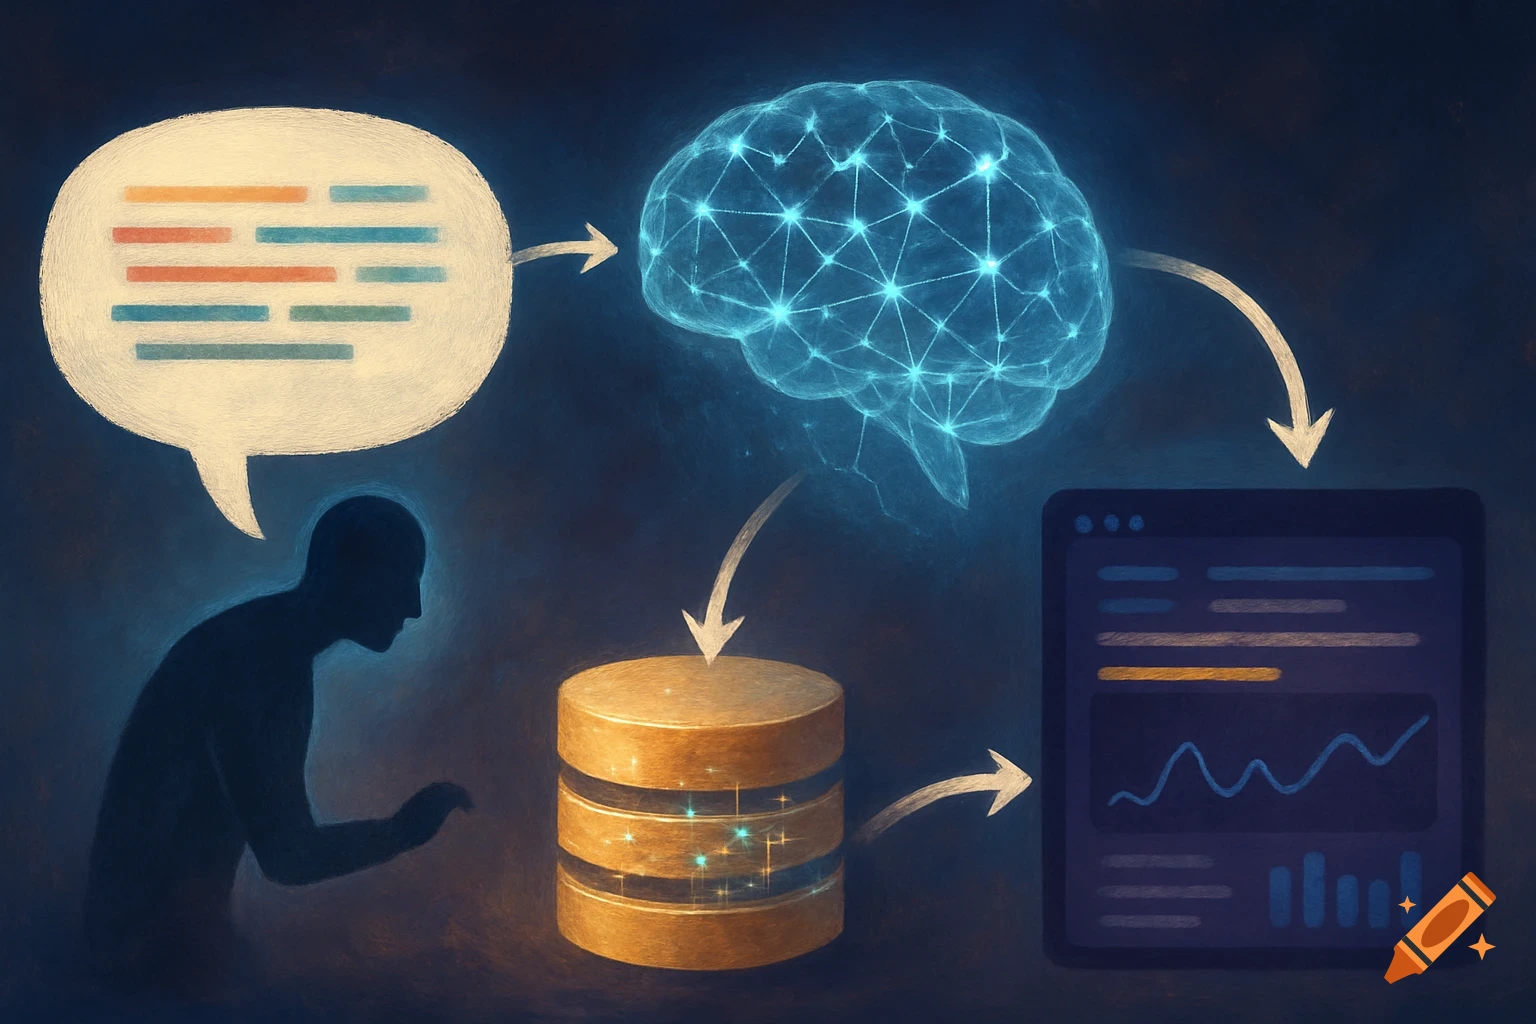
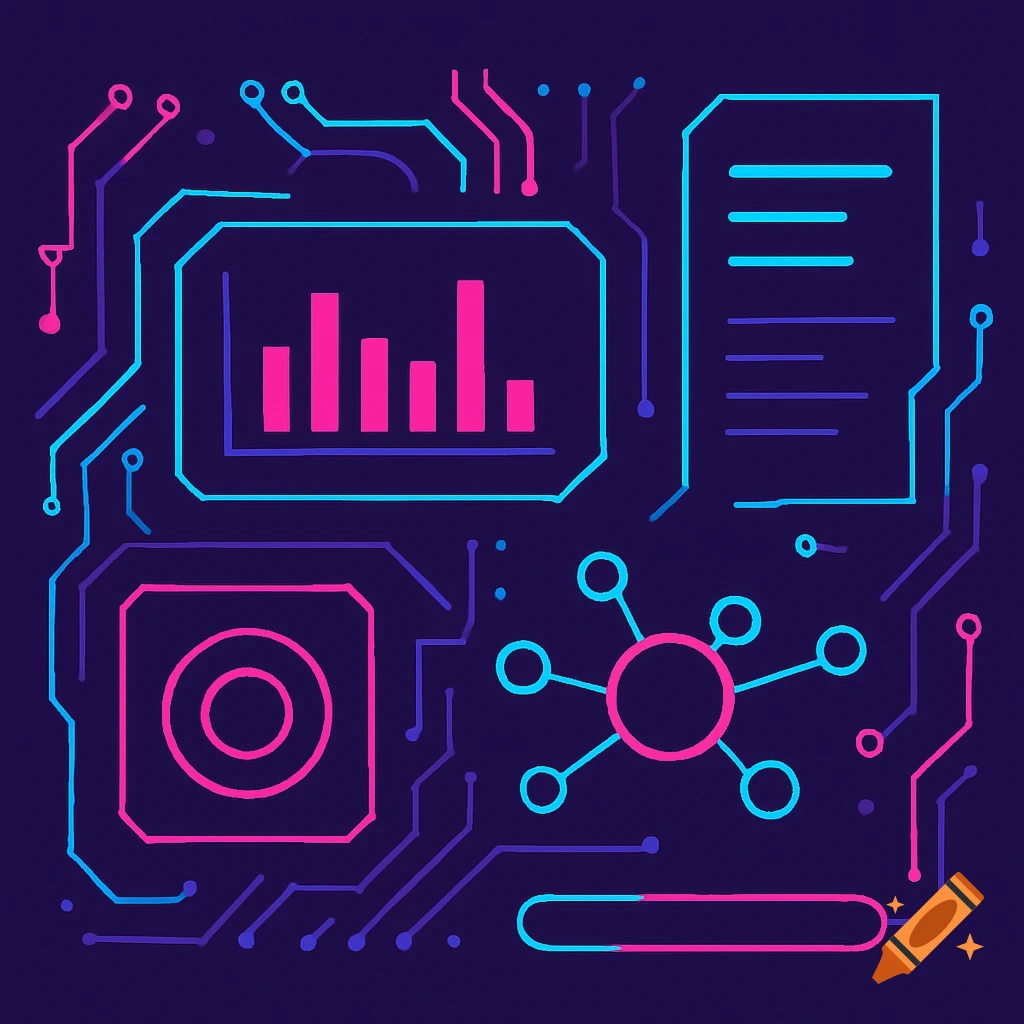
A futuristic diagram illustrating how algorithms learn biases from historical data, with glowing boxes, arrows, charts, and icons on a dark blue background.
Diagrama que ilustra cómo el algoritmo "aprende" sesgos a partir de datos históricos Ver mais