A computer monitor displays a detailed financial graph titled 'Historical Volatility of Gold in Major Crashes', showing gold price fluctuations and significant drops marked with red arrows and dates, on an office desk.
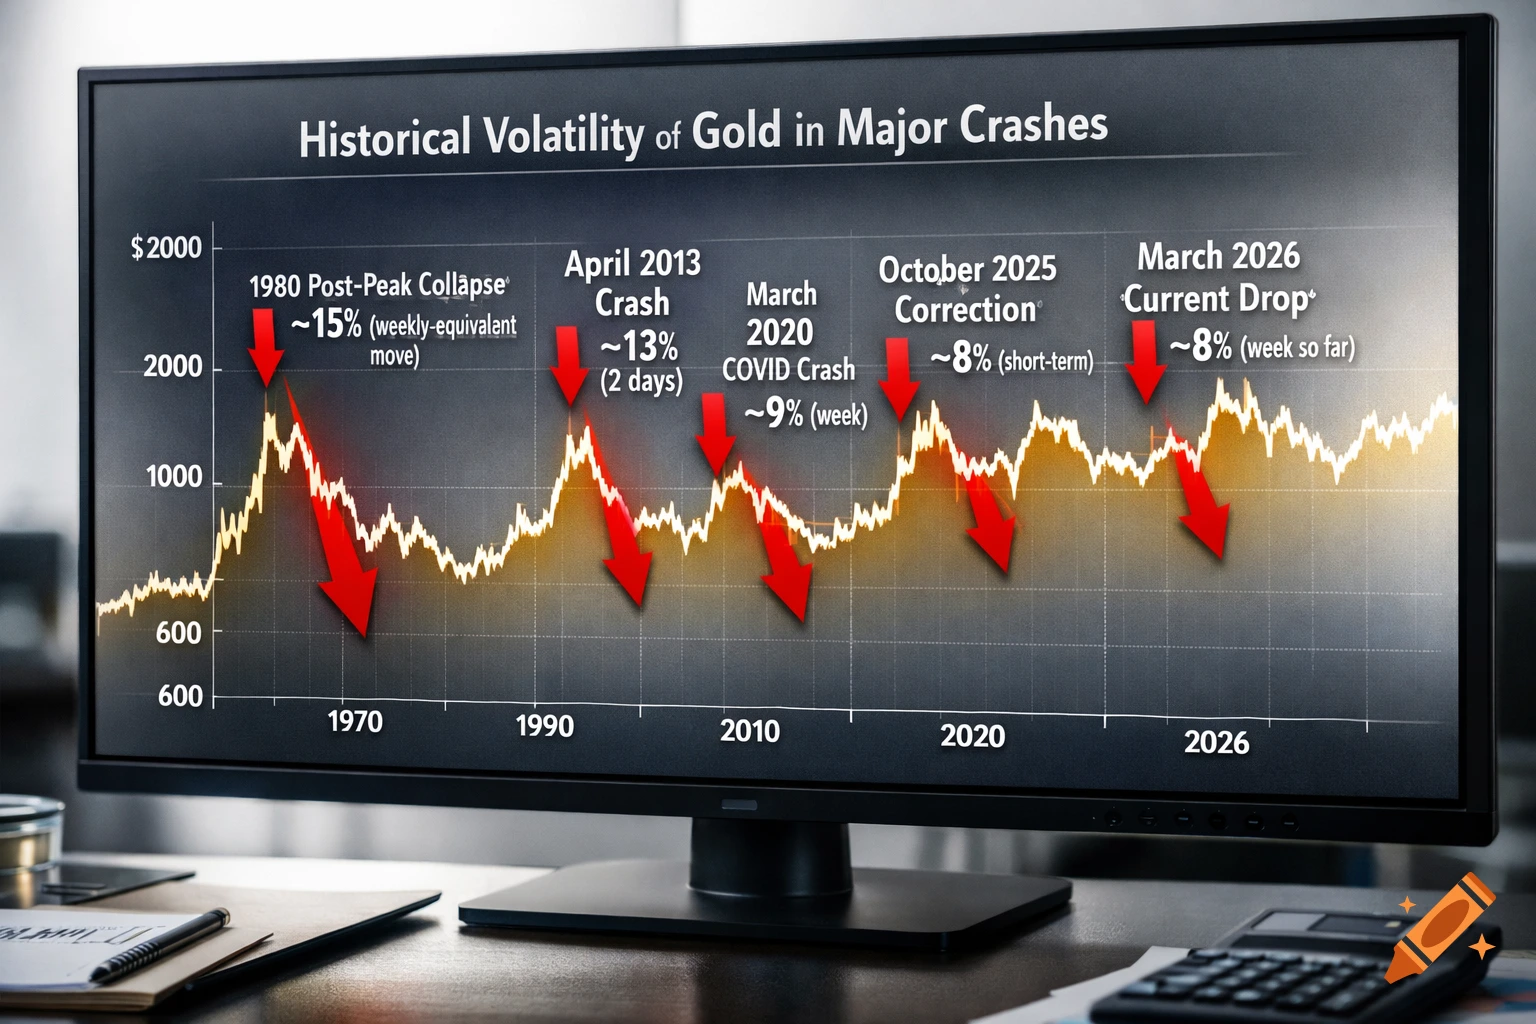
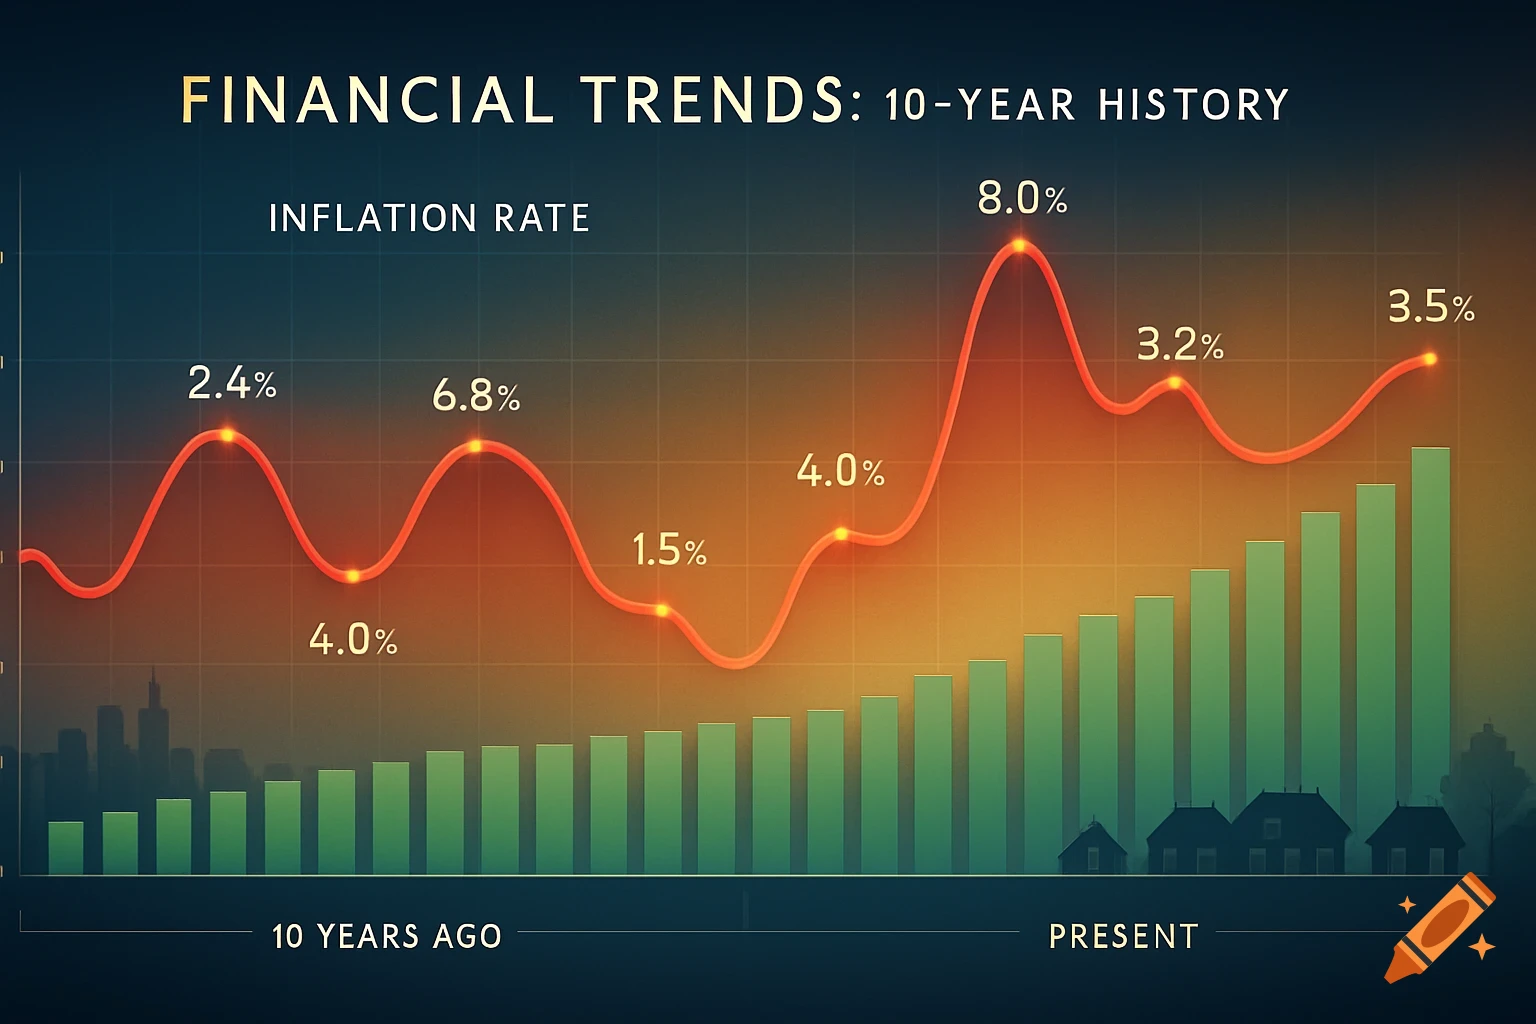
Gold worse week. Gold Worst Week 1980 Post-Peak Collapse • 📉 ~–15% (weekly-equivalent move) April 2013 Crash • 📉 ~–13% (2 days) 3. March 2020 COVID Crash • 📉 ~–9% (week) March 2026 Current Drop • 📉 ~–8% (week so far) October 2025 Correction • 📉 ~–8% (short-term) Ver mais
More images like this