A diagram illustrating the Urban Heat Island effect, showing temperatures in urban forest, dense urban, and park areas.
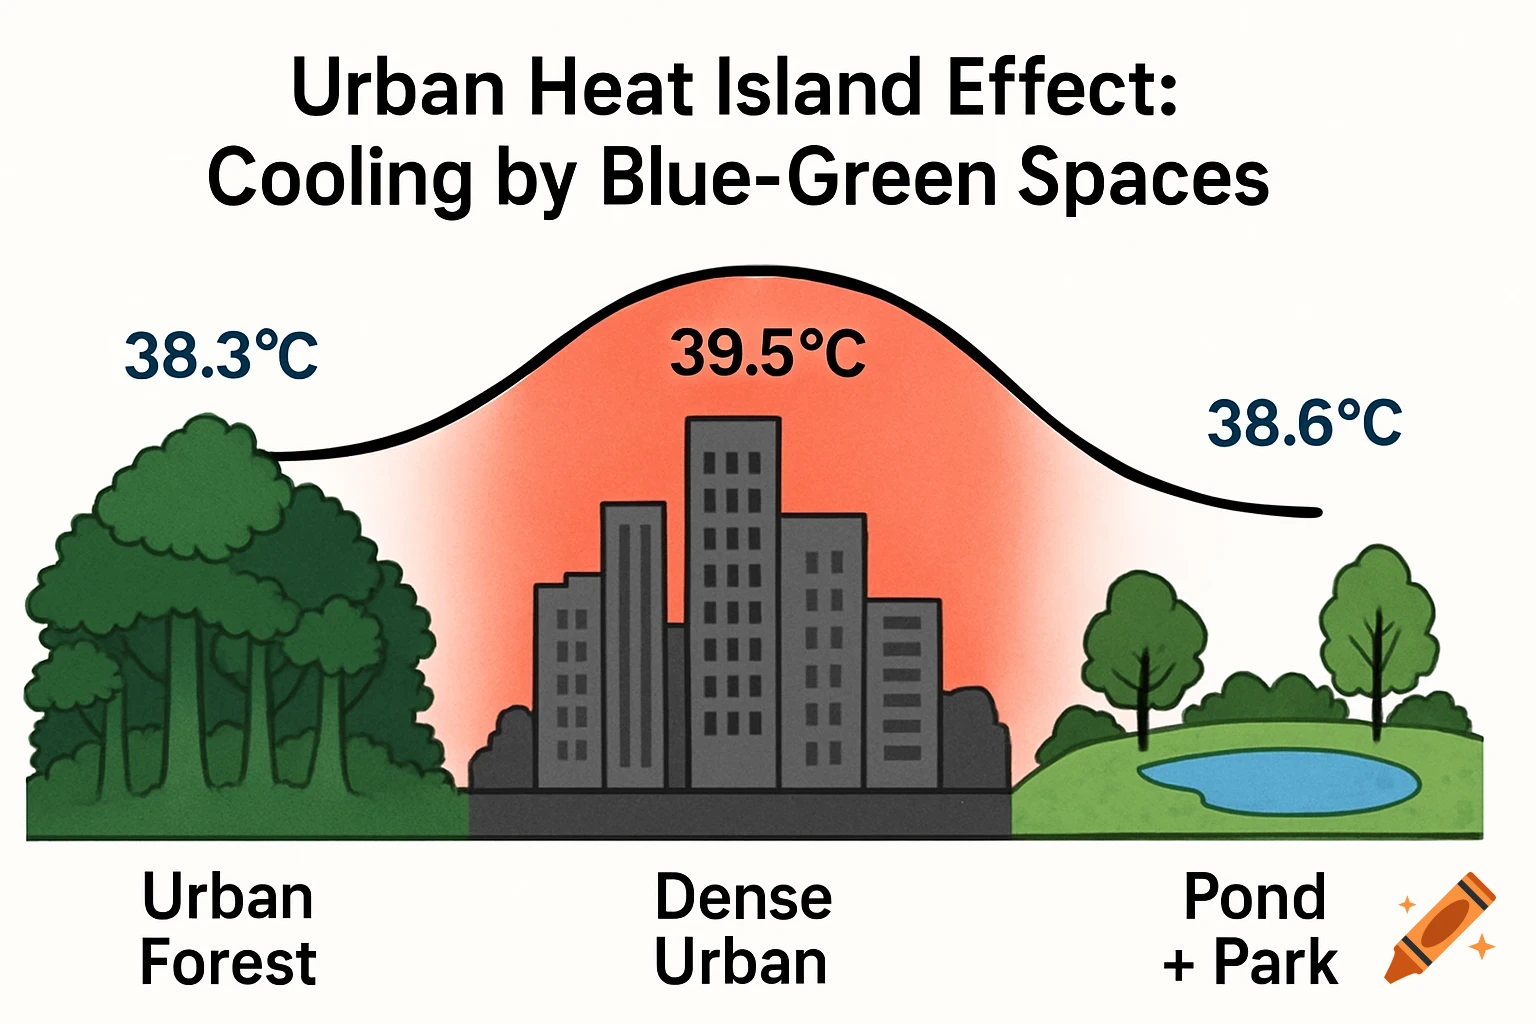
Create a scientific figure showing the Urban Heat Island effect with the following EXACT specifications: Layout (MUST follow this order from left to right): LEFT SIDE: Urban Forest (dense trees with multiple layers) CENTER: Dense Urban Area (tall buildings, concrete, minimal vegetation) RIGHT SIDE: Pond + Park combined area (water body with surrounding park/grass) Temperature Profile Requirements: Draw a smooth curved line above the landscape showing temperature variation CENTER (Urban Area): Temperature PEAKS at 39.5°C (highest point) LEFT (Forest): Temperature drops to 38.3°C (BIGGER dip - 1.2°C cooling) RIGHT (Pond + Park): Temperature drops to 38.6°C (SMALLER dip - 0.9°C cooling) Make the curve smooth and continuous, showing gradual transitions Specific Visual Elements: Urban Forest (left): Multiple layers of trees (canopy, understory) Dark green color Show dense vegetation Urban Area (center): Tall gray buildings of varying heights Concrete/asphalt surfaces Minimal to no vegetation Use darker gray/black for roads Pond + Park (right): Blue water body (pond) Surrounding green grass/park area Few scattered trees Show as integrated feature Color Scheme: Urban area: Gray/dark gray with red/orange heat overlay Forest: Dark green with blue/cool overlay Pond: Blue water Park: Light green Temperature line: Thick red or black line Labels (EXACT spelling): Title: "Urban Heat Island Effect: Cooling by Blue-Green Spaces" Label left area: "Urban Forest" Label center: "Dense Urban Ver mais
More images like this