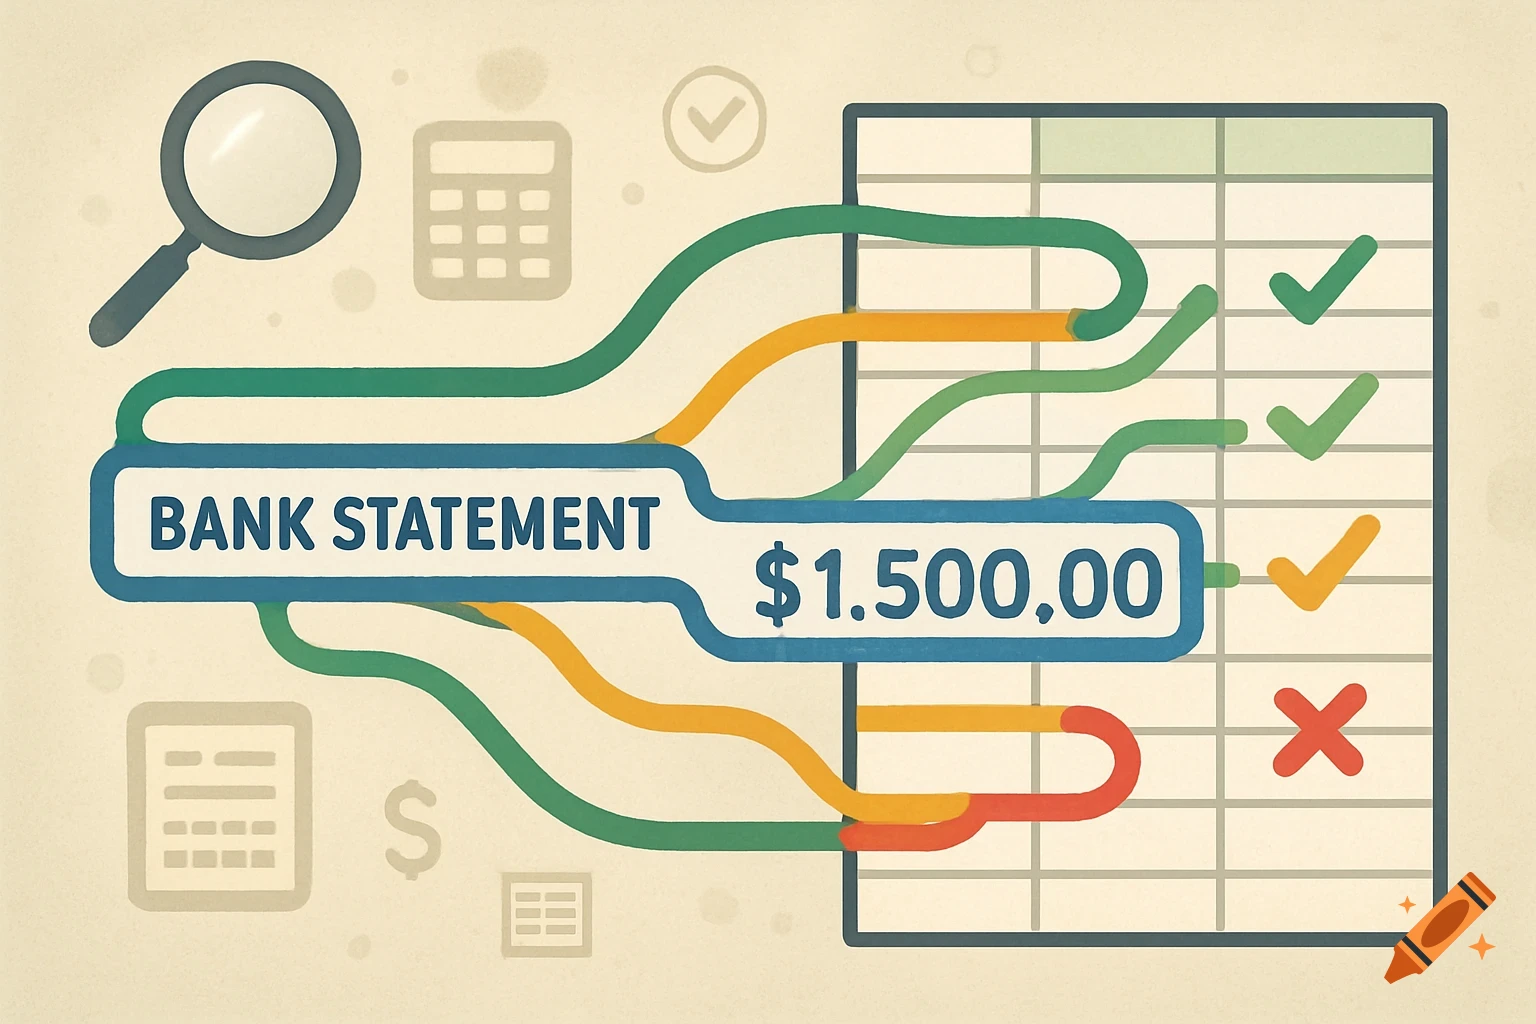
A business presentation slide titled 'Financial Clarity System – Executive Summary' detailing company financial metrics.
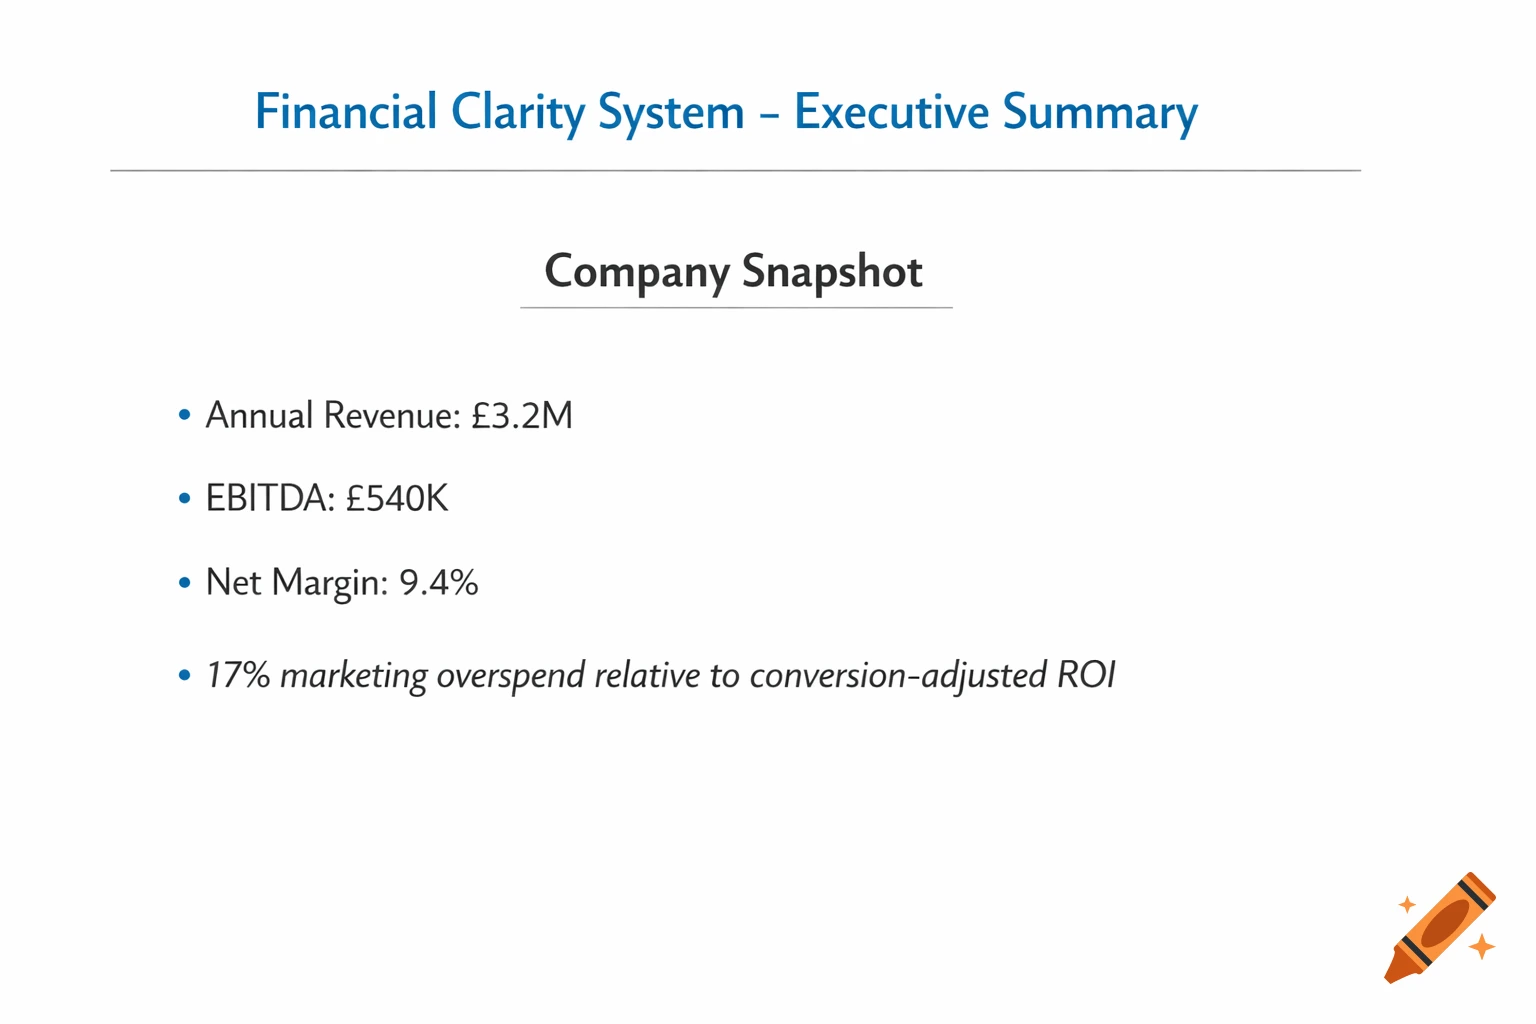
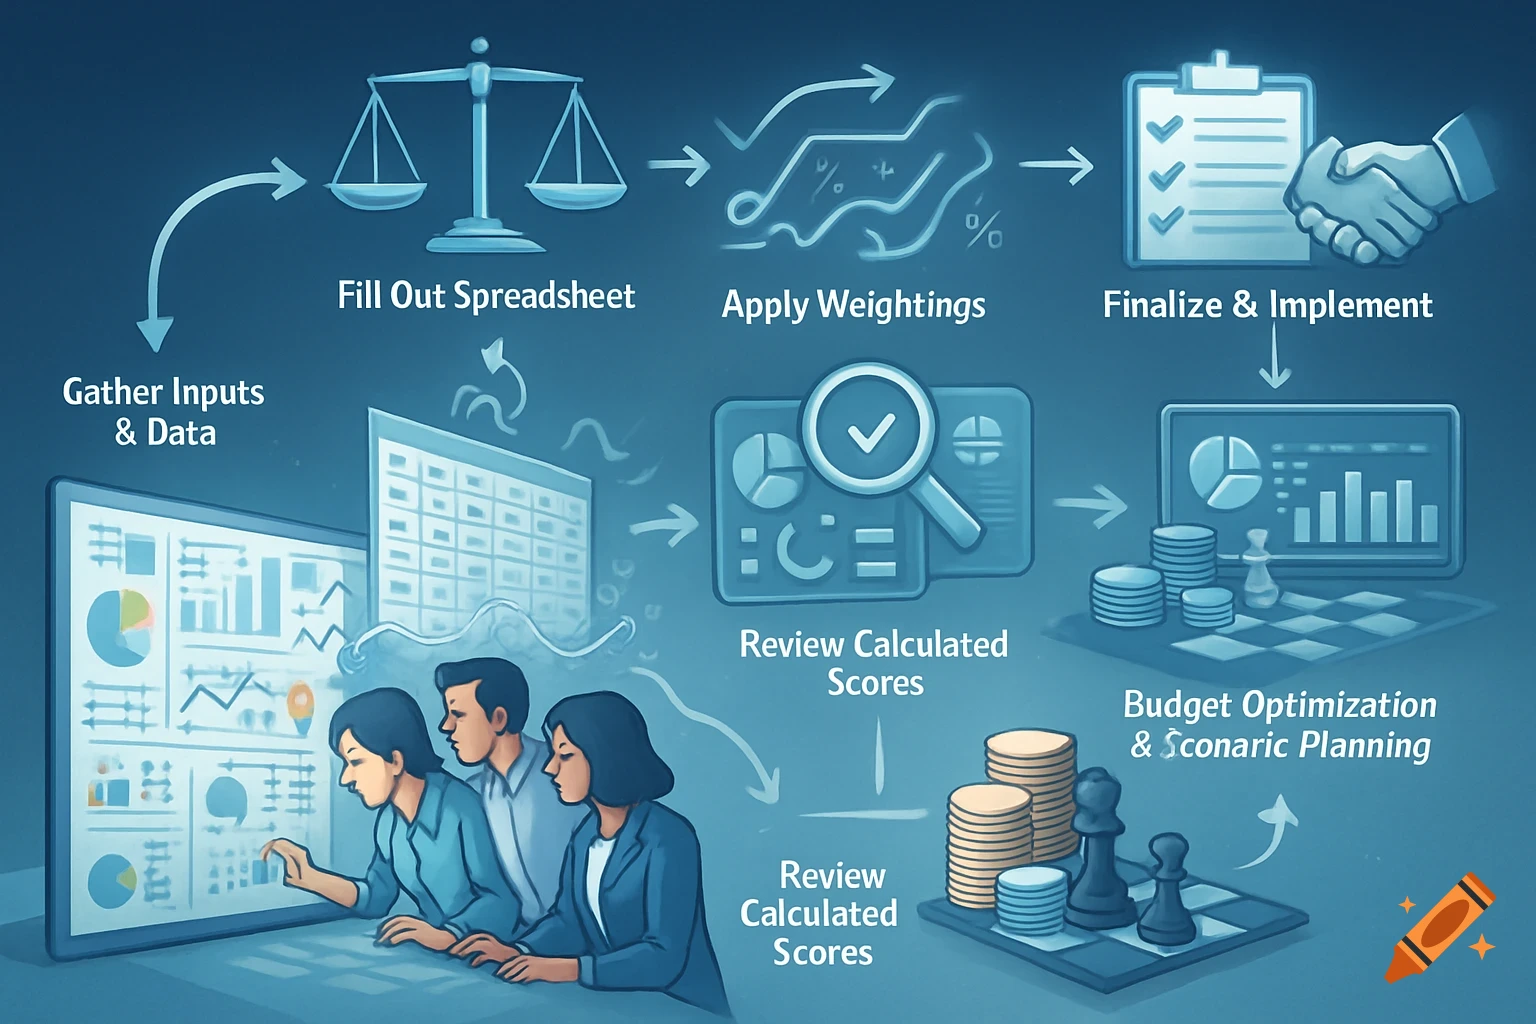
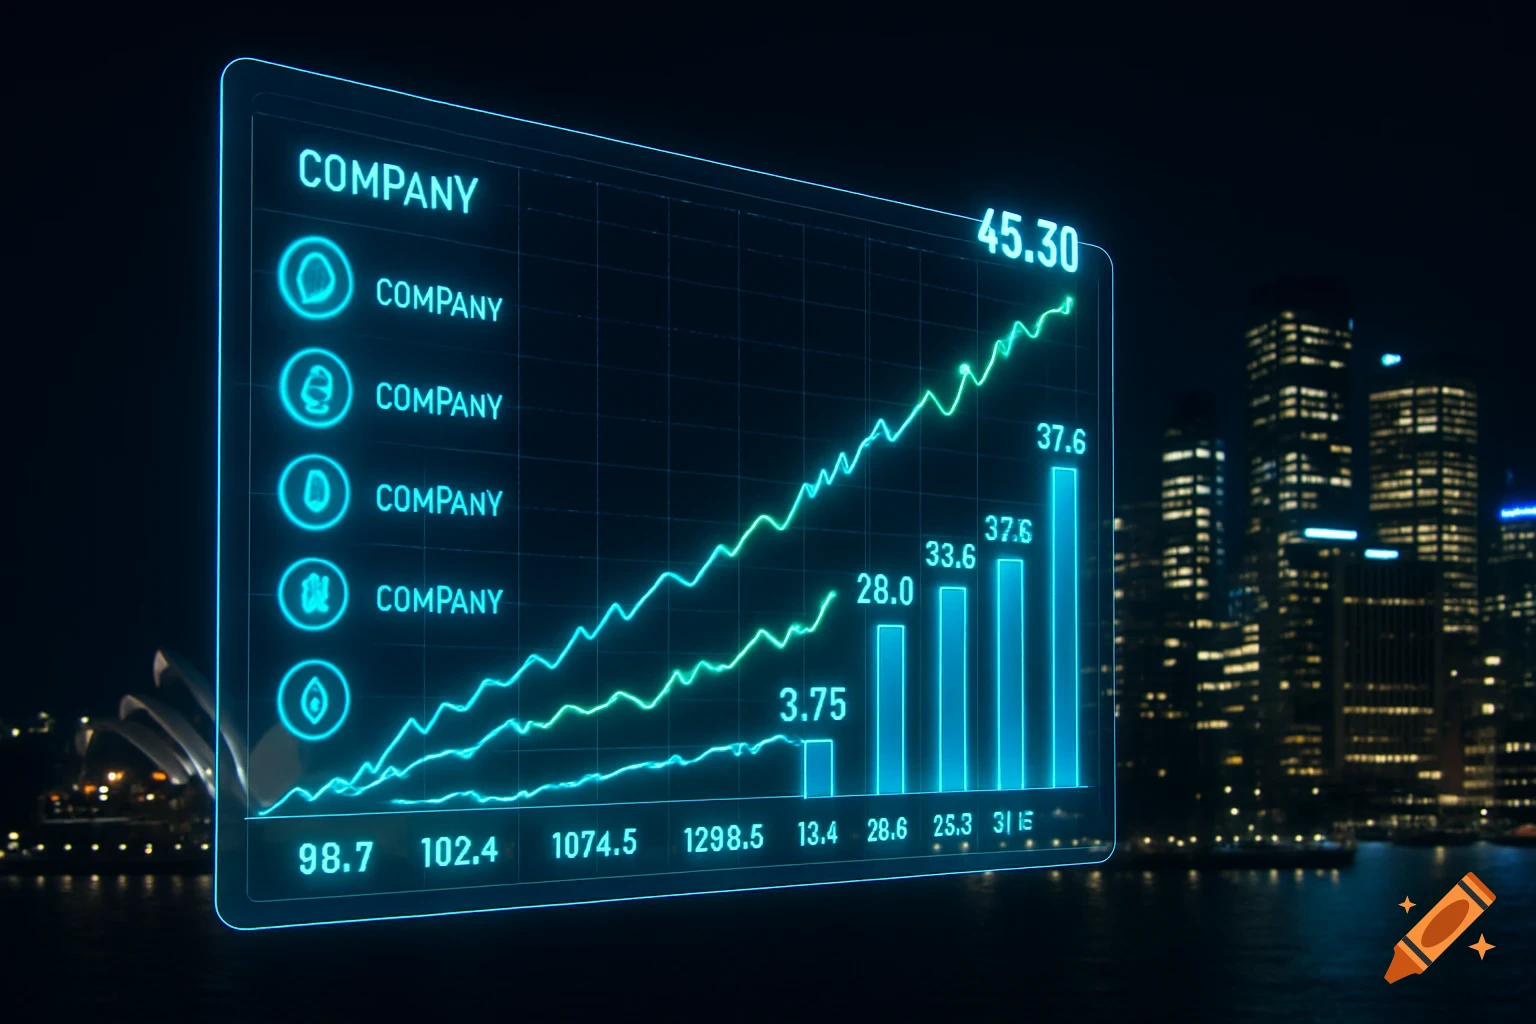
PAGE 1 – Executive Summary Header: Financial Clarity System – Executive Summary Company Snapshot (Fictional): Annual Revenue: £3.2M EBITDA: £540K Net Margin: 9.4% Cash Runway: 5.2 months Key Findings: • 17% marketing overspend relative to conversion-adjusted ROI • Operational cost creep of 6.8% YoY • Margin compression driven by underpriced service tier Strategic Leverage Points: • Reallocate £120K from low-yield marketing channels • Restructure pricing tiers to recover 3–5% margin • Improve cash forecasting accuracy via rolling 12-month model Minimal text. Bullet precision. No fluff. ⸻ PAGE 2 – KPI Dashboard Title: Core Performance Indicators Metrics (visual tiles or horizontal layout): • Revenue Growth: 8.2% YoY • Gross Margin: 42% • Net Margin: 9.4% • Customer Acquisition Cost: £1,240 • Lifetime Value: £6,800 • Cash Conversion Cycle: 74 days Include: • Line graph (Revenue over 12 months) • Bar chart (Margin trend) • Small EBITDA progression visual All charts clean, high contrast, no color clutter. ⸻ PAGE 3 – Profit & Margin Breakdown Title: Revenue & Cost Structure Analysis Revenue Streams (Pie Chart): • Core Service: 68% • Retainers: 22% • One-off Projects: 10% Cost Allocation (Bar Chart): • Marketing: 28% • Payroll: 34% • Operations: 18% • Admin: 12% • Misc: 8% Insight Block: “Marketing spend exceeds efficiency threshold by 15–20% relative to pipeline yield.” This page visually communicates leakage. ⸻ PAGE 4 – 12-Month Forecast Title: Scenario Modeling Three scenario Ver mais
More images like this