An infographic titled "Stagnation vs. Growth" showing two paths. The left, in gray, depicts a loop of consumption leading to stagnation. The right, in blue, shows an ascending staircase representing growth and creating one's own narrative. A timestamp "2026年7月18日 18:55" is in the top right.
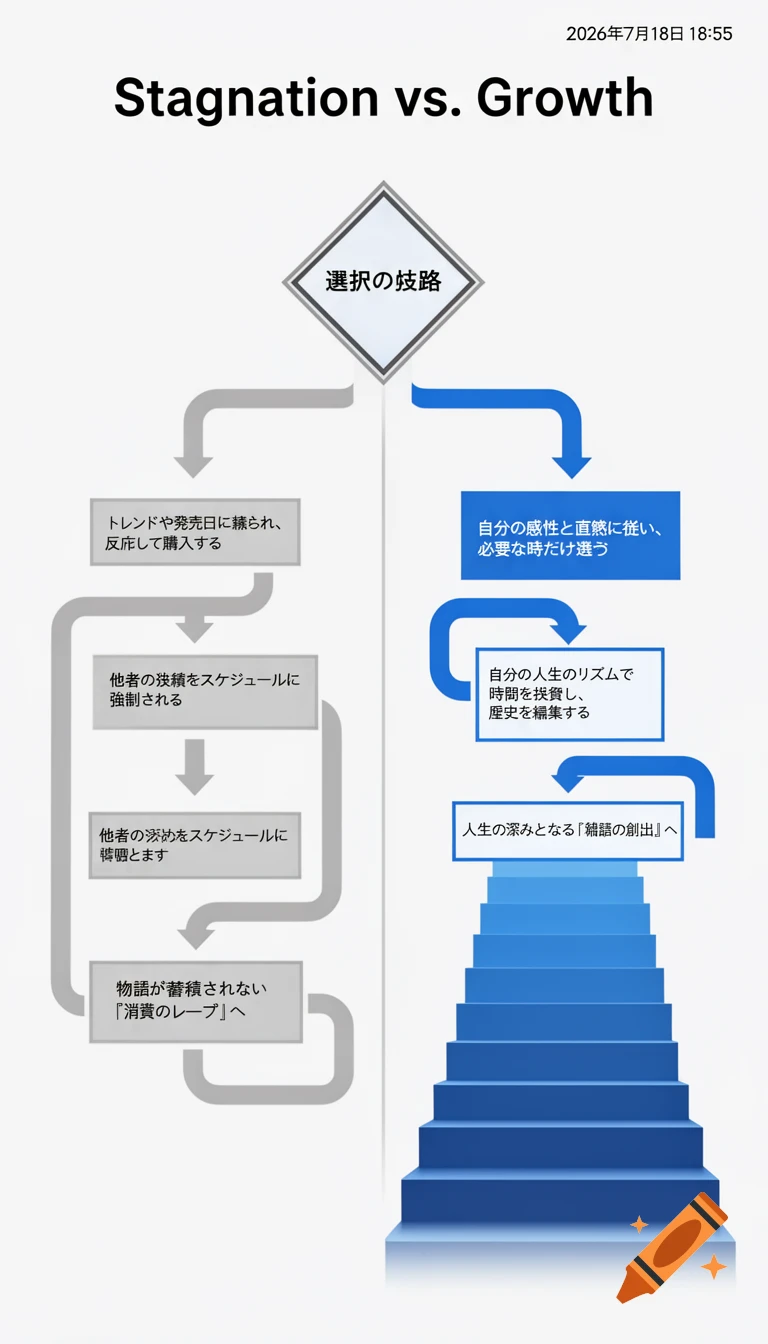
# Visual Narrative Flowchart Specification ## 1. Goal Generate a vertical 9:16 infographic. Avoid making it look like a static list. The design must visually communicate "Stagnation vs. Growth" through shape and flow. ## 2. Immutable Timestamp (Top Right) "2026年7月18日 18:55" (Constraint: Black text, top right.) ## 3. Visual Strategy (The "Narrative" Approach) - Central Start: "選択の岐路" (A diamond shape). - Left Branch (The "Loop"): - Use boxes that look like "containers" or "circular paths." - Arrows should be circular or jagged, suggesting a trapped, repetitive cycle. - Color: Desaturated, muted grey. - Right Branch (The "Growth"): - Use boxes that become progressively larger or more open, suggesting expansion. - Arrows should be straight, strong, and dynamic, pointing towards an open horizon. - Color: Clean, vibrant, professional blue. ## 4. Mandatory Text (Exact Match) ### Central Start - "選択の岐路" ### Left Branch (Cool Grey) - Step 1: "トレンドや発売日に煽られ、反応して購入する" - Step 2: "他者の決めたスケジュールに強制される" - Final Box: "物語が蓄積されない「消費のループ」へ" ### Right Branch (Vibrant Blue) - Step 1: "自分の感性と直感に従い、必要な時だけ選ぶ" - Step 2: "自分の人生のリズムで時間を投資し、歴史を編集する" - Final Box: "人生の深みとなる「物語の創出」へ" ## 5. Visual Constraints - Background: Clean off-white (to avoid sterility). - Style: Modern infographic. Use line weight and shape variance to tell the story—not icons. - Clarity: The left side feels like a "drain," the right side feels like a "staircase or upward path." Ver mais
More images like this