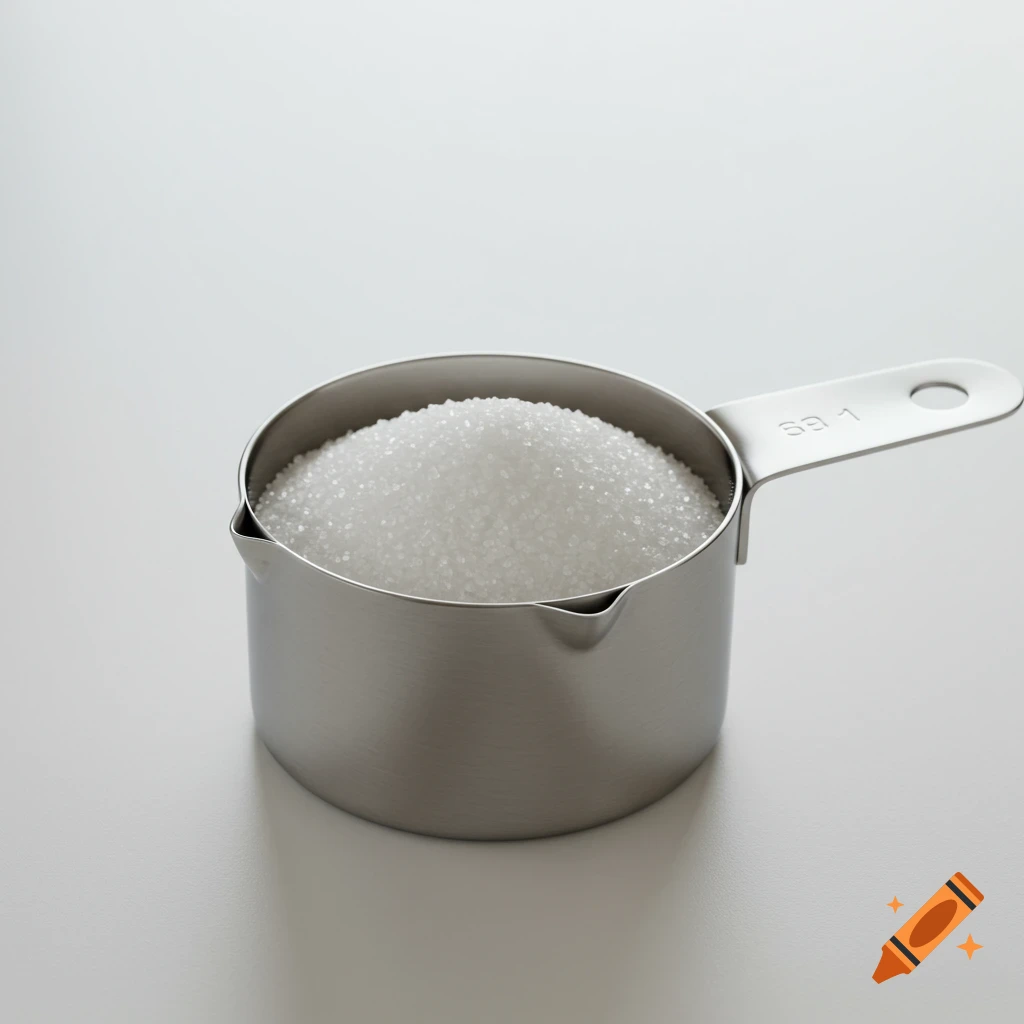
Infographic comparing daily added sugar intake: 9 teaspoons for men (36g) and 6 teaspoons for women (25g).

Create a clean popular science infographic illustration. Show a simple side-by-side comparison: Left: “Men – 36 g added sugar per day” with 9 teaspoons filled with sugar. Right: “Women – 25 g added sugar per day” with 6 teaspoons filled with sugar. Each teaspoon represents one teaspoon of sugar. Use clear labels and simple icons. Flat, modern infographic style. Light, neutral background. Educational, clear, and non-commercial. No advertising style. Ver mais
More images like this