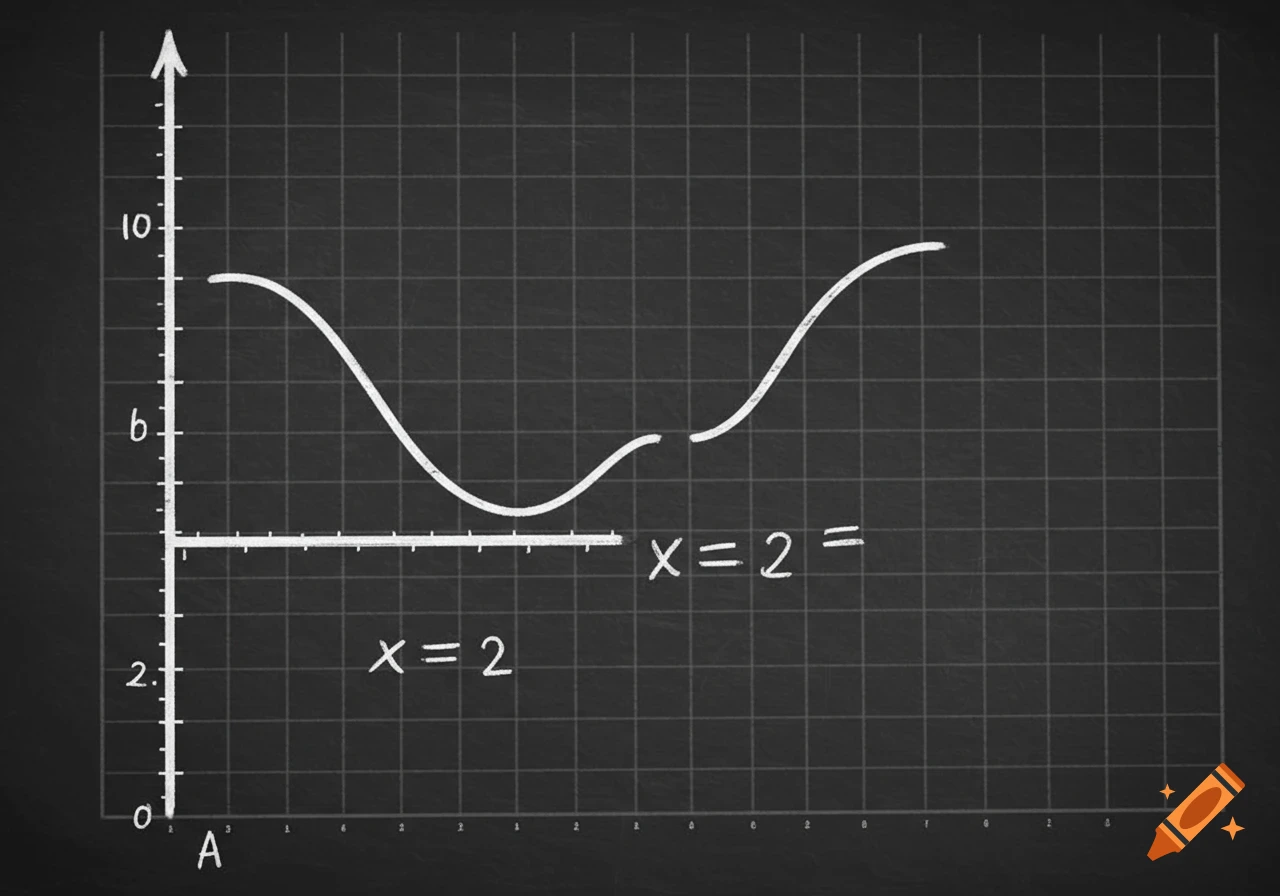
A graph showing two overlapping parabolas, one blue opening up and one red opening down, on a textured background.
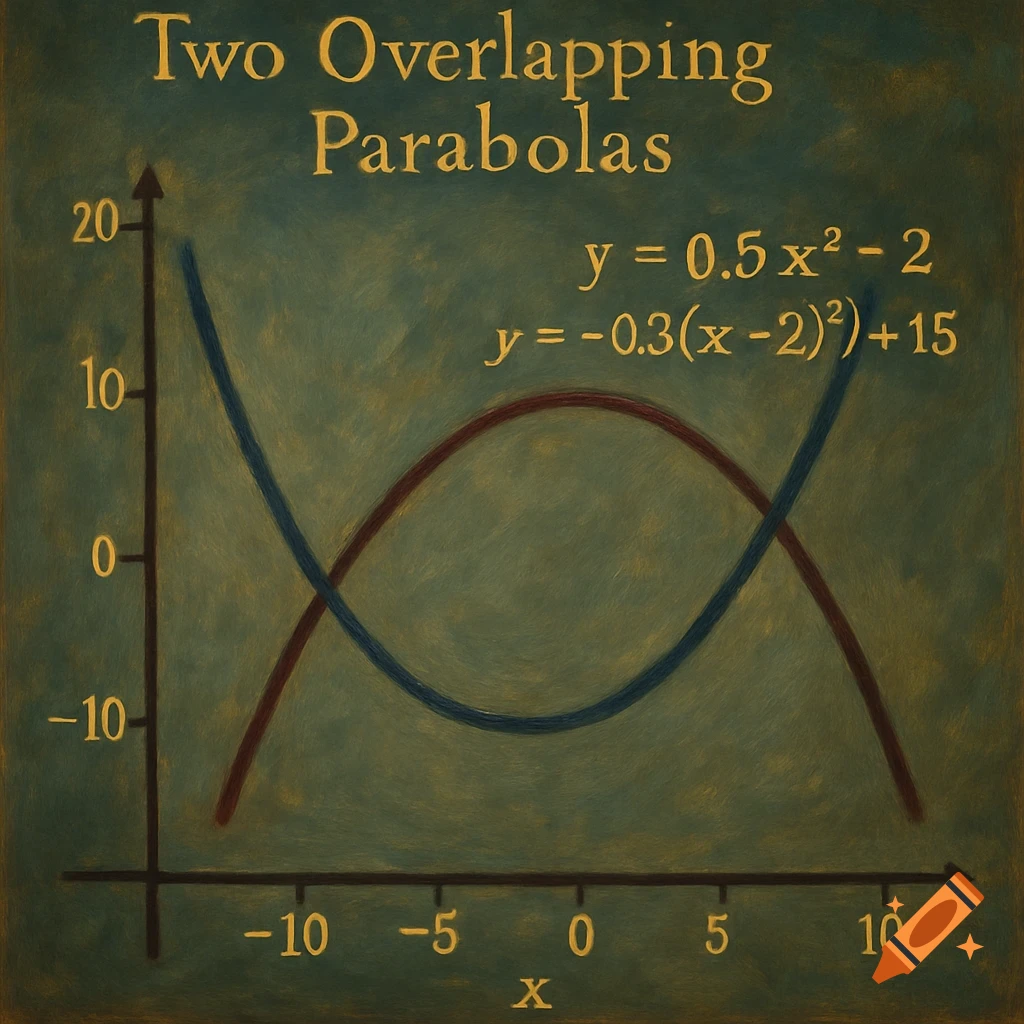
import numpy as np import matplotlib.pyplot as plt # Generate x values from -10 to 10 for smooth curves x = np.linspace(-10, 10, 400) # Define two quadratic functions # First parabola: opens upward, shifted slightly y1 = 0.5 * x**2 - 2 # Second parabola: opens downward, shifted slightly y2 = -0.3 * (x - 2)**2 + 15 # Plot the parabolas plt.plot(x, y1, label='y = 0.5x^2 - 2') plt.plot(x, y2, label='y = -0.3(x - 2)^2 + 15') # Set y-axis limits from -10 to 20 plt.ylim(-10, 20) # Add labels and legend plt.xlabel('x') plt.ylabel('y') plt.title('Two Overlapping Parabolas') plt.legend() # Show the plot plt.show() Ver mais
More images like this