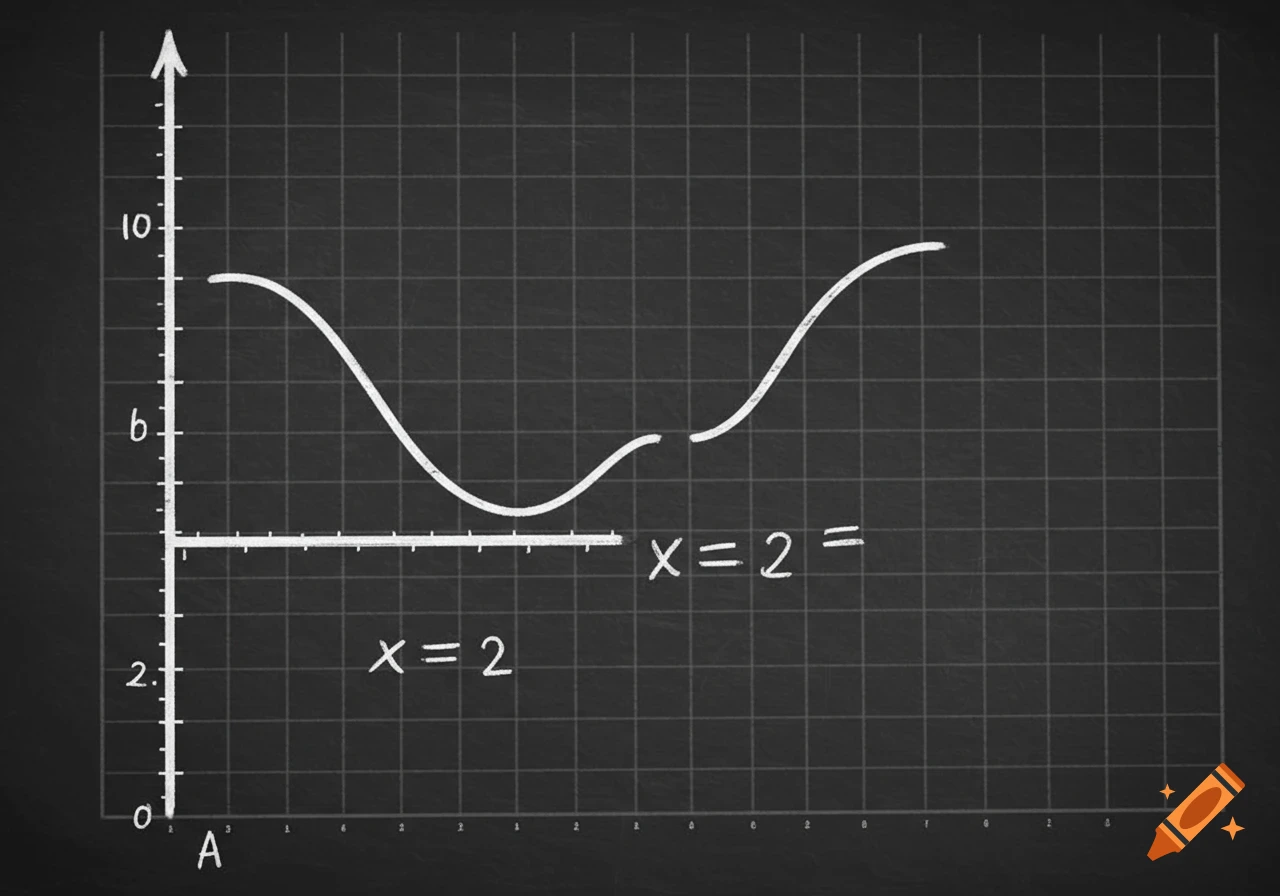
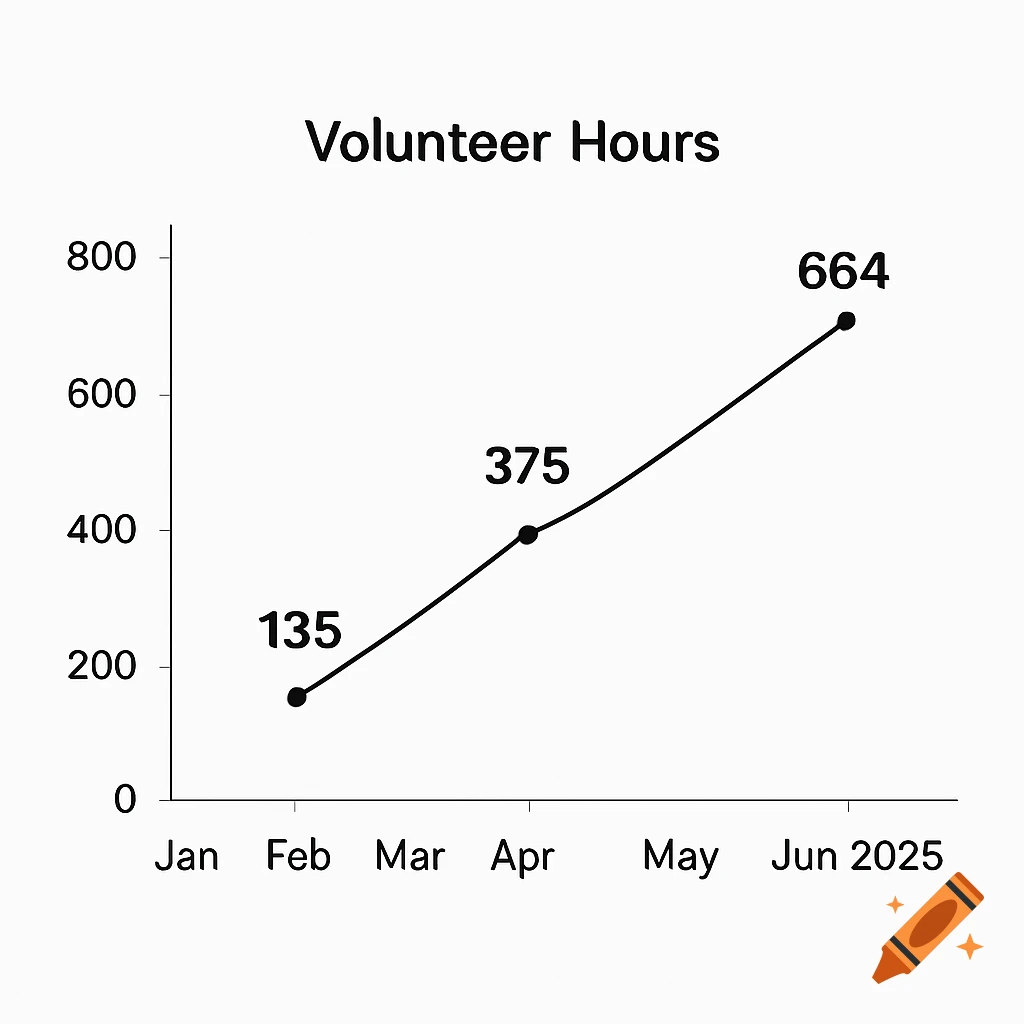
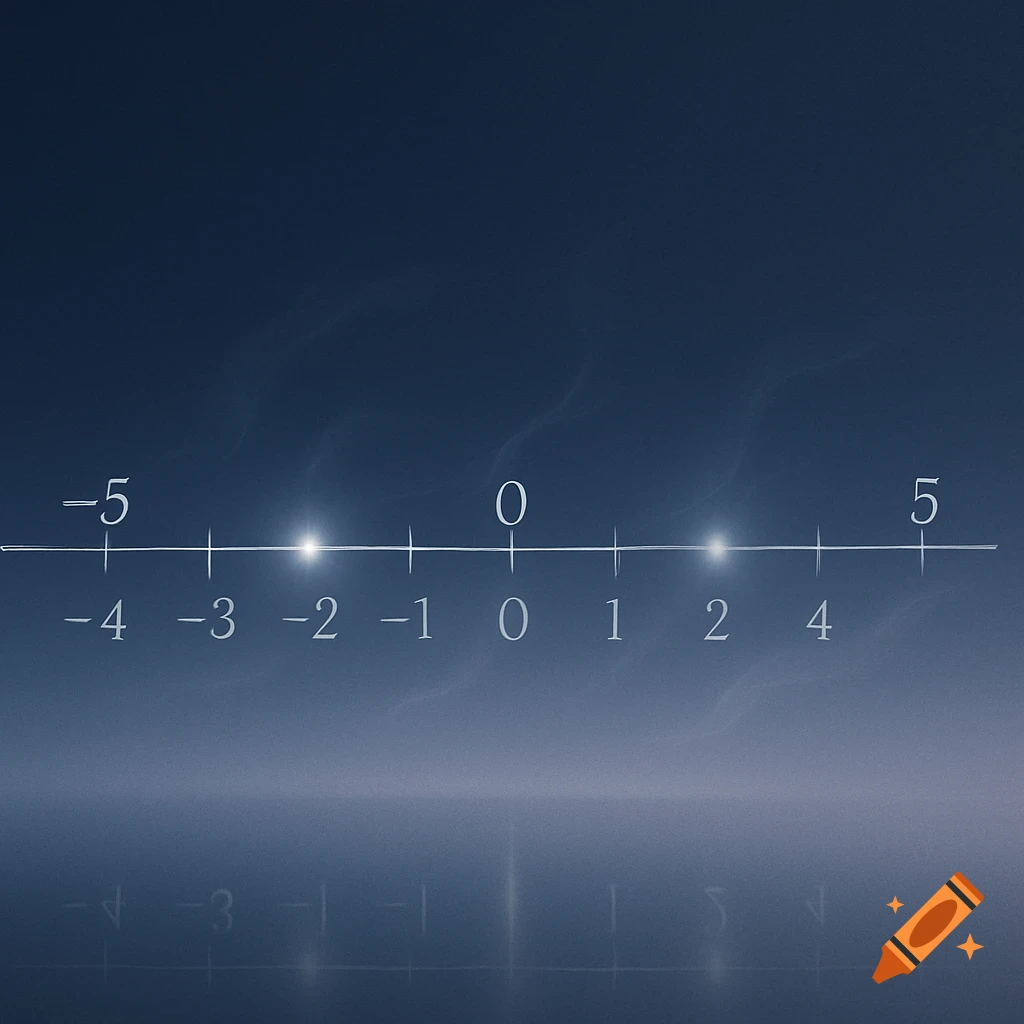
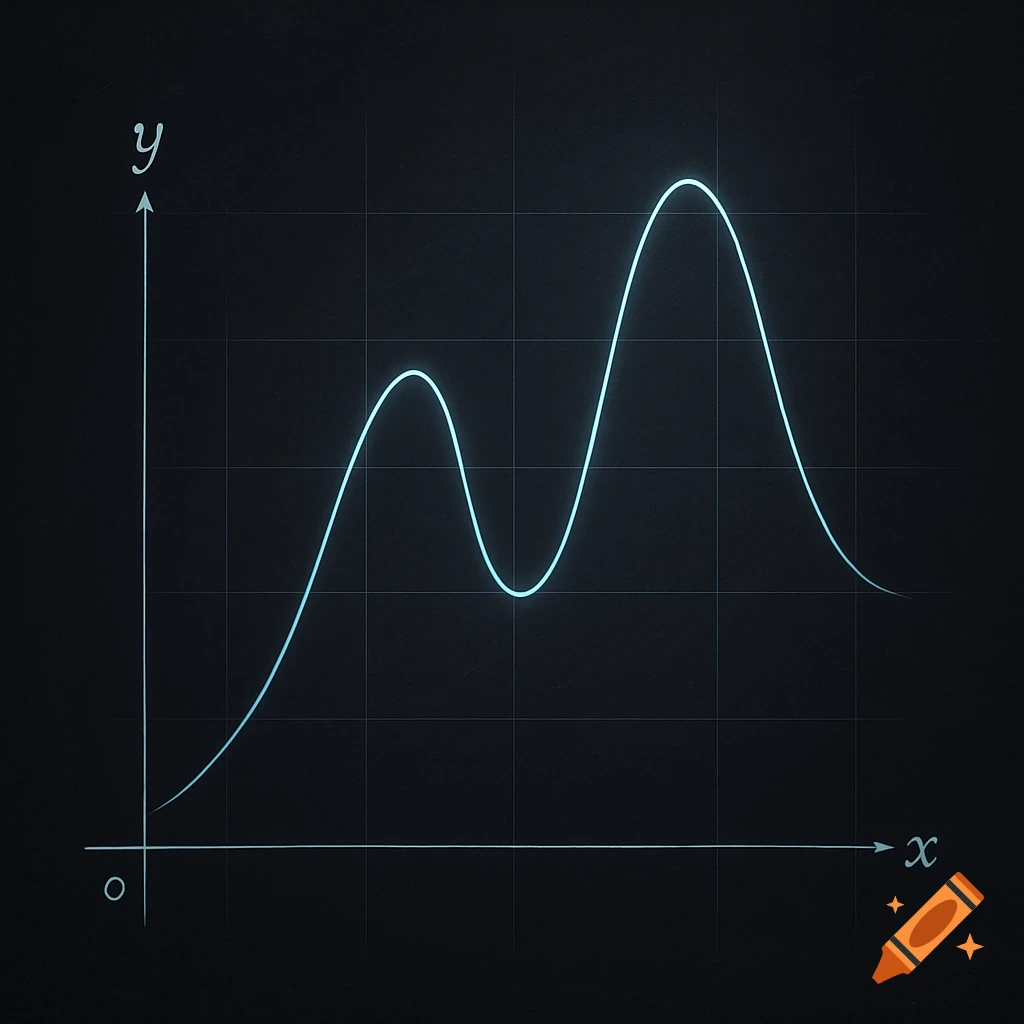
Graph of a sine wave with labeled Max and Min points and axes with dates and numbers.

### Parameters: - **Amplitude ( )**: 4 - **Midline ( )**: 8 - **Period**: 366 days - **Horizontal shift ( )**: 90 days (the maximum occurs on day 90) ### Graphing Steps: 1. **Determine Key Points**: - **Max Point**: On day 90, (Maximum) - **Min Point**: On day 273, (Minimum) - **Mid Points**: You can find midpoints (e.g., around days 1, 182, 365) where the function crosses the midline. 2. **Identify the X-axis**: - Label the x-axis from January 1 (day 1) to December 31 (day 365). 3. **Plotting the Graph**: - Start plotting the basic sine wave based on the function. - Use the maximum and minimum points. - Continue the wave shape reflecting around the midline. 4. **Vertical Scale**: - The y-axis should range from at least 0 to 12 to capture all values. ### Graph: You can use graphing software or a graphing calculator to visualize the function. Plot the points and ensure that the sinusoidal shape is smooth and continuous. make me a graph with the information i gave you Mehr sehen
More images like this