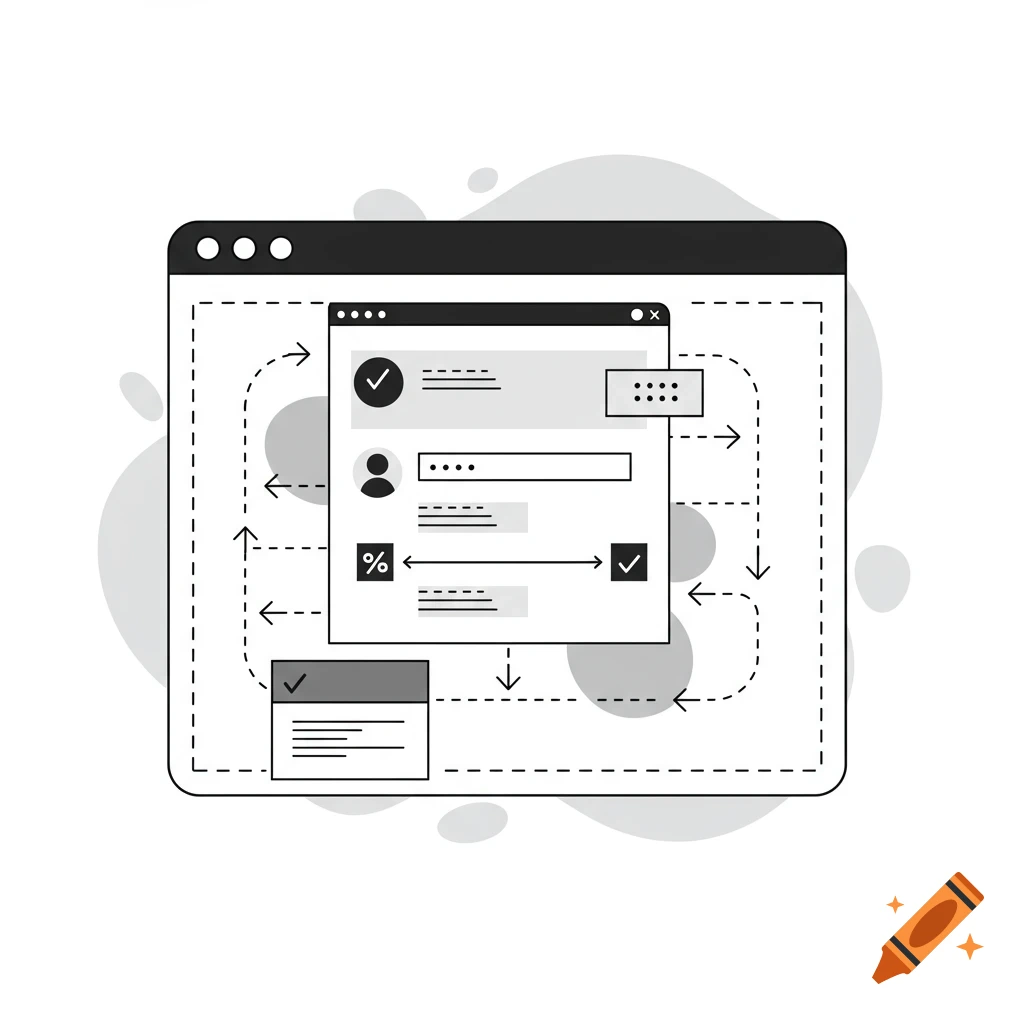
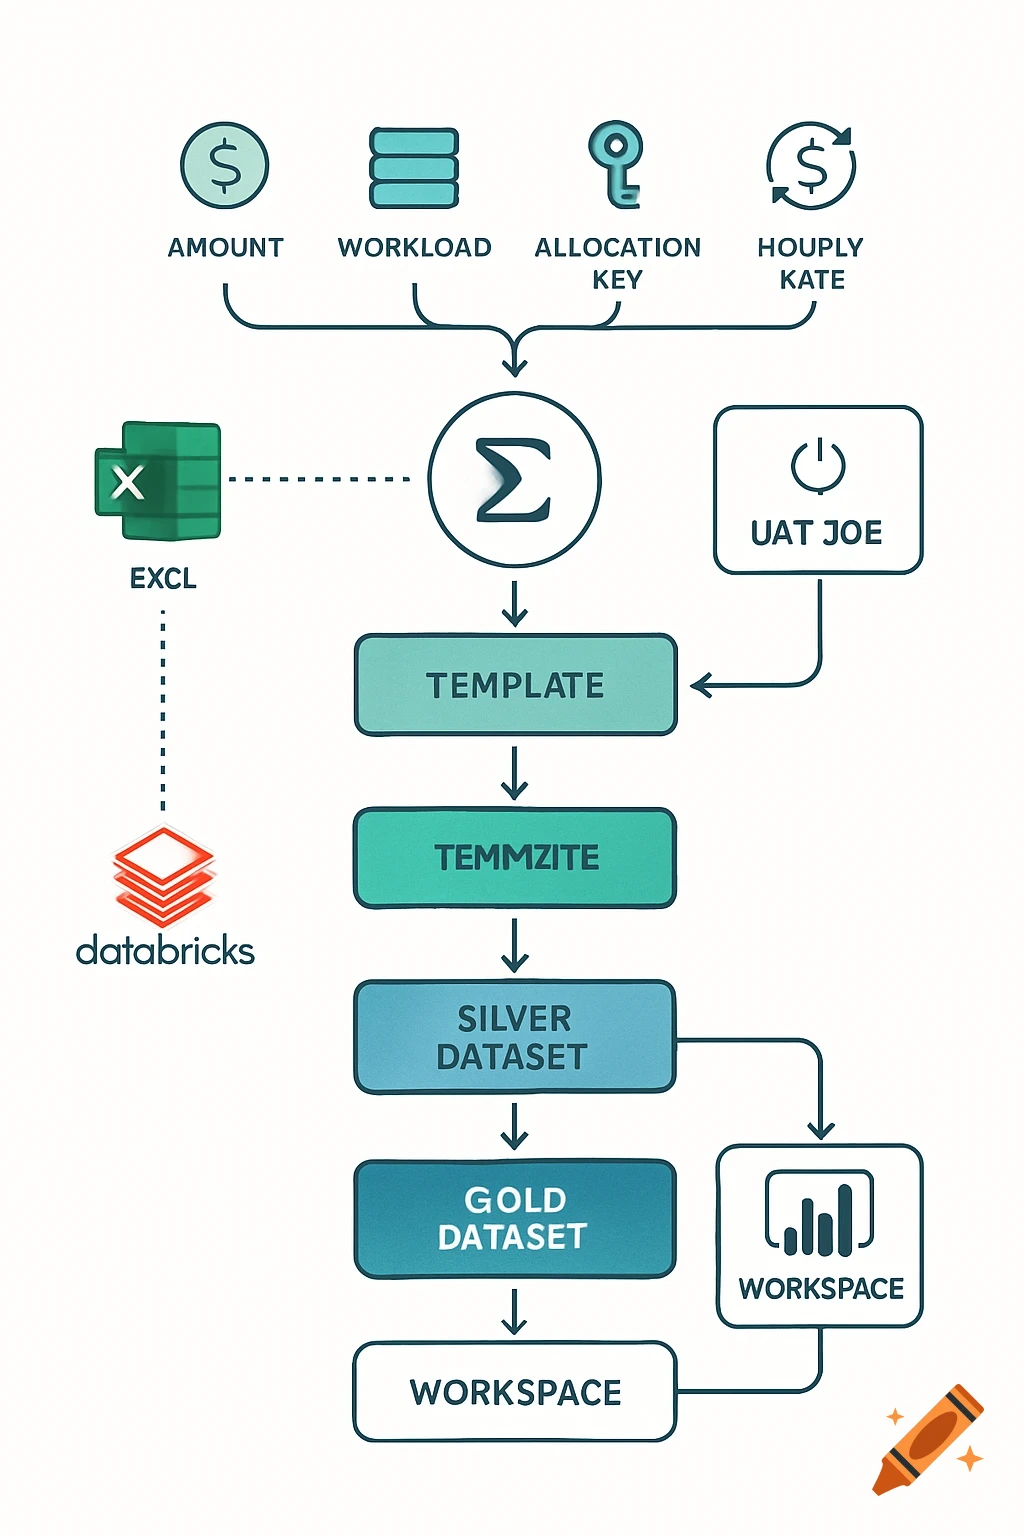
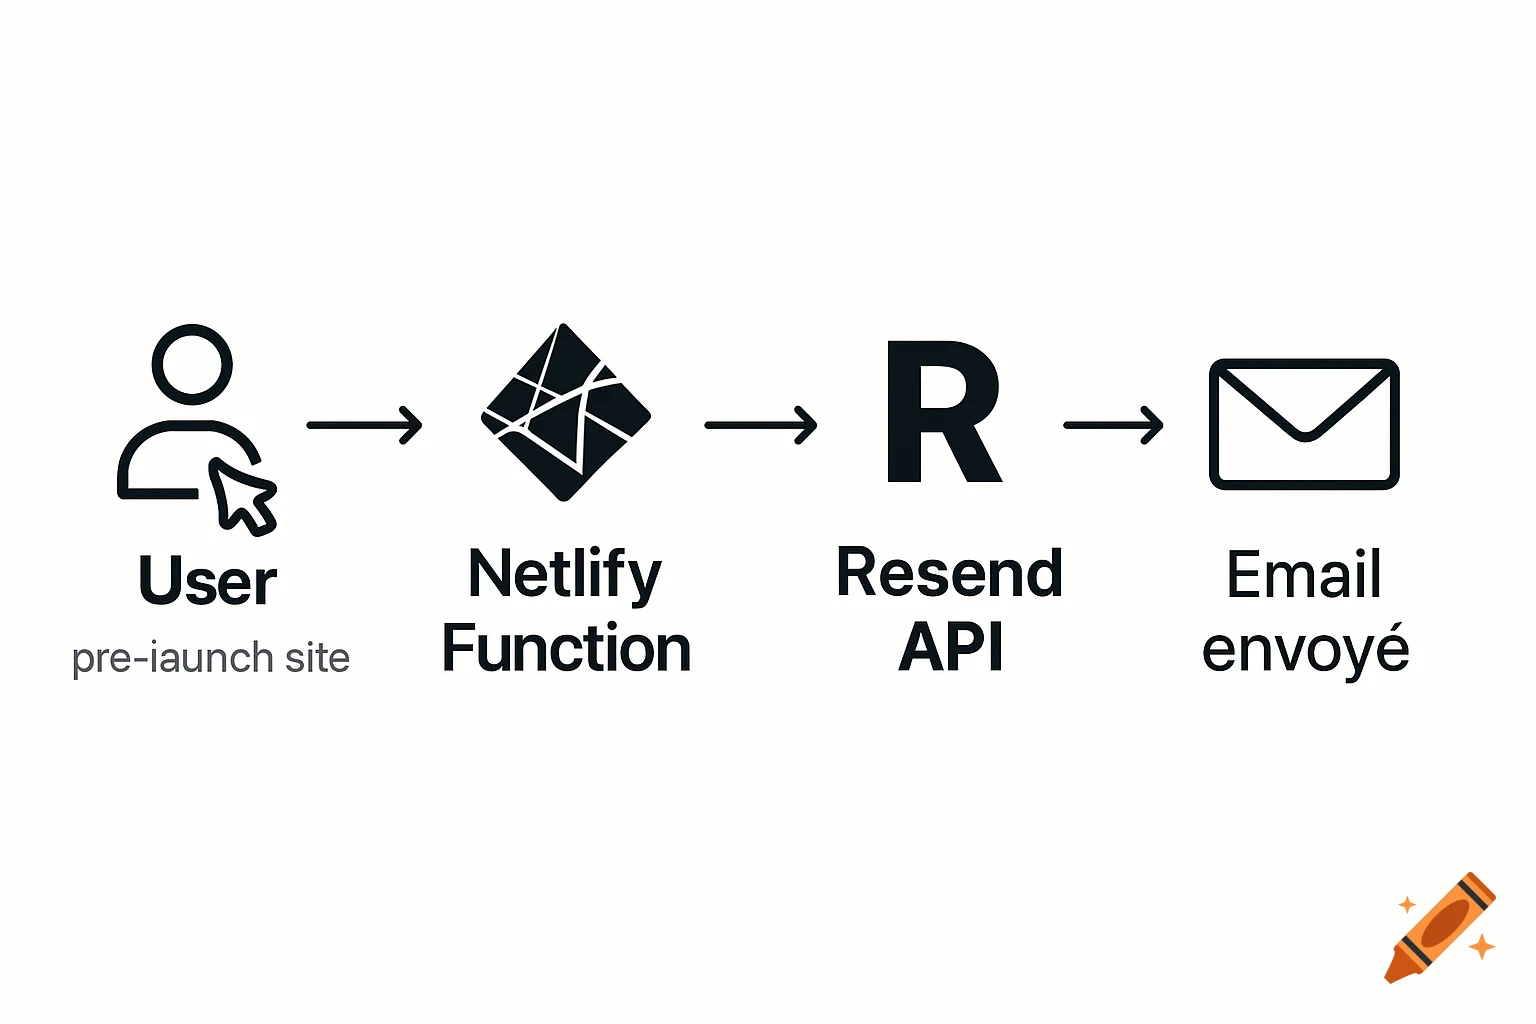
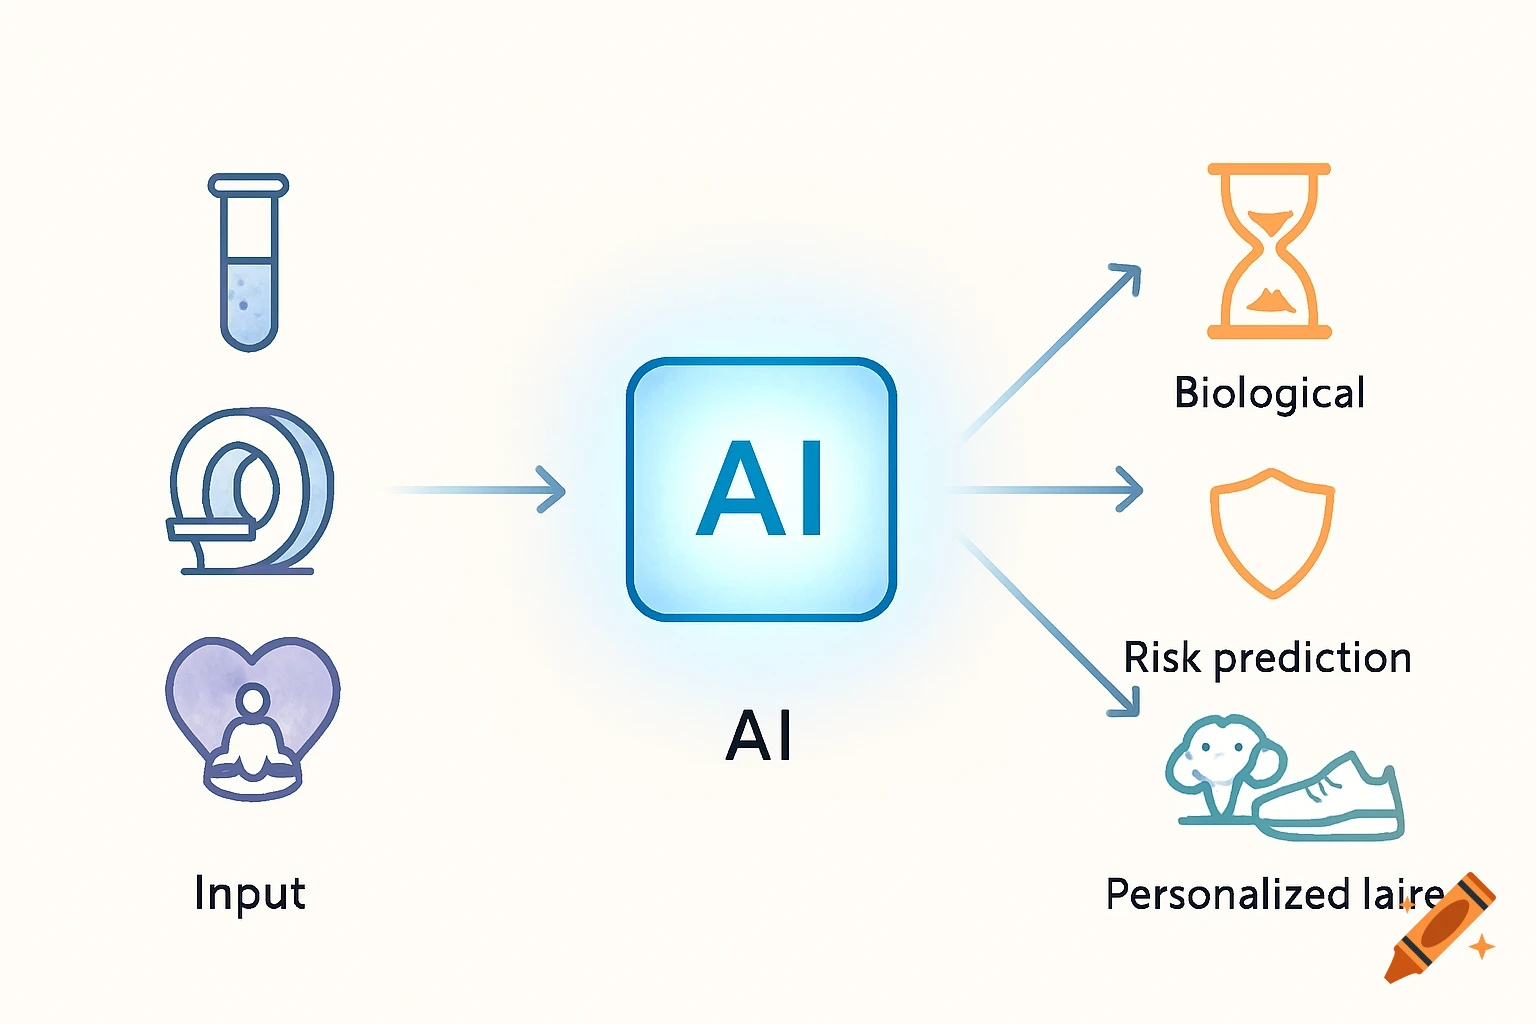
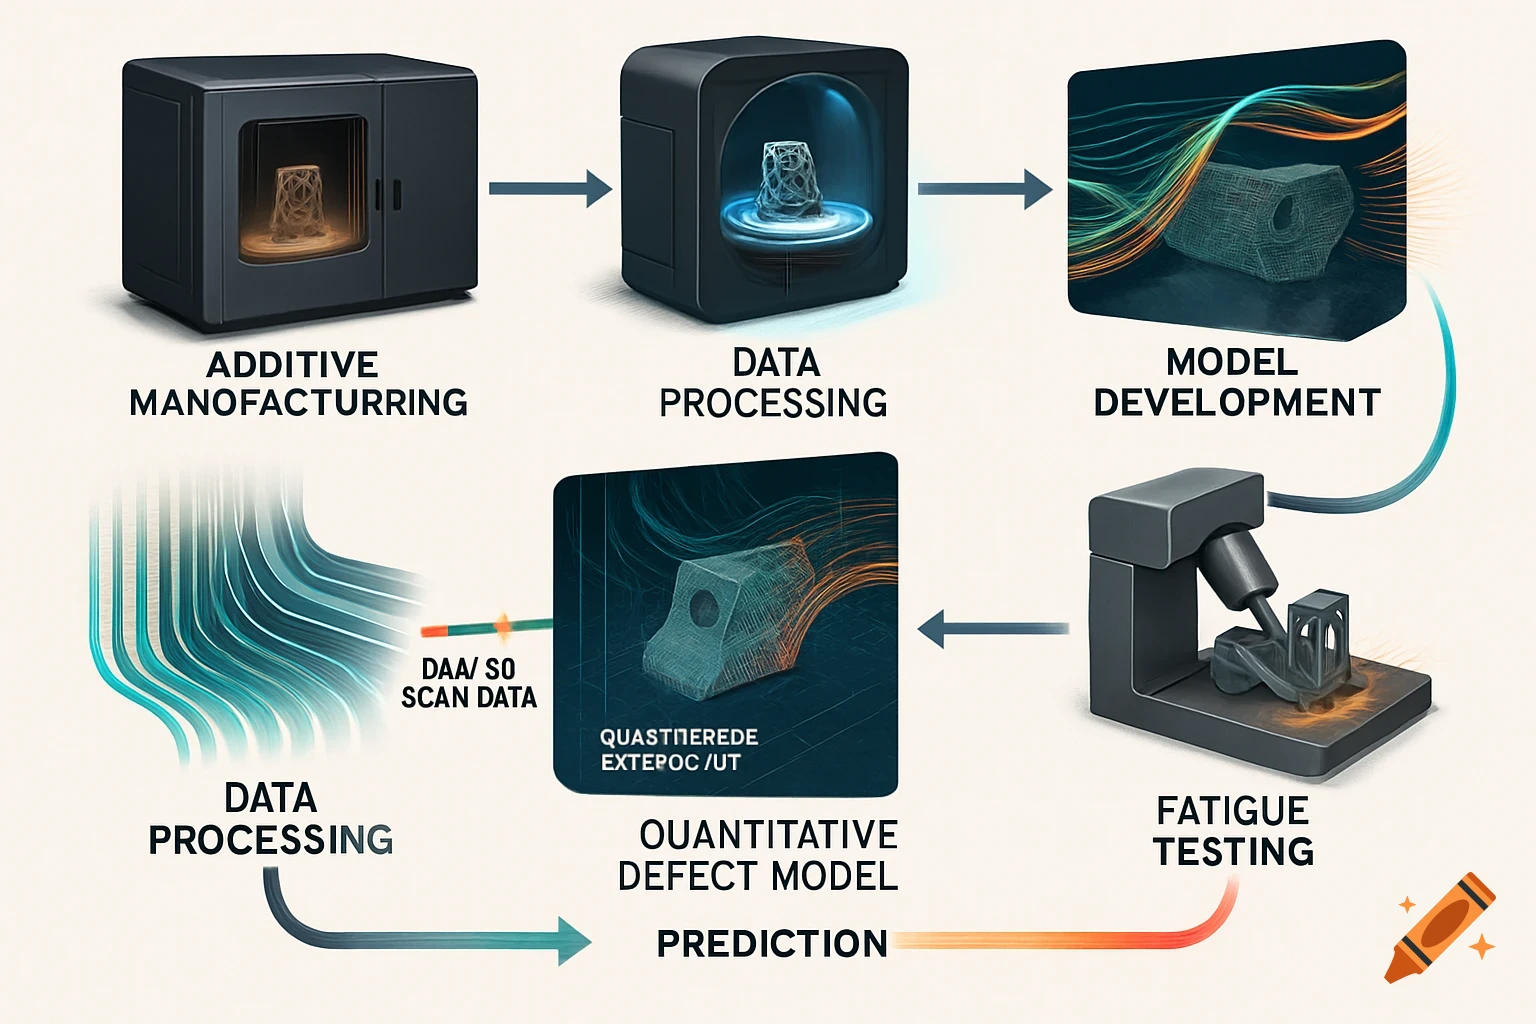
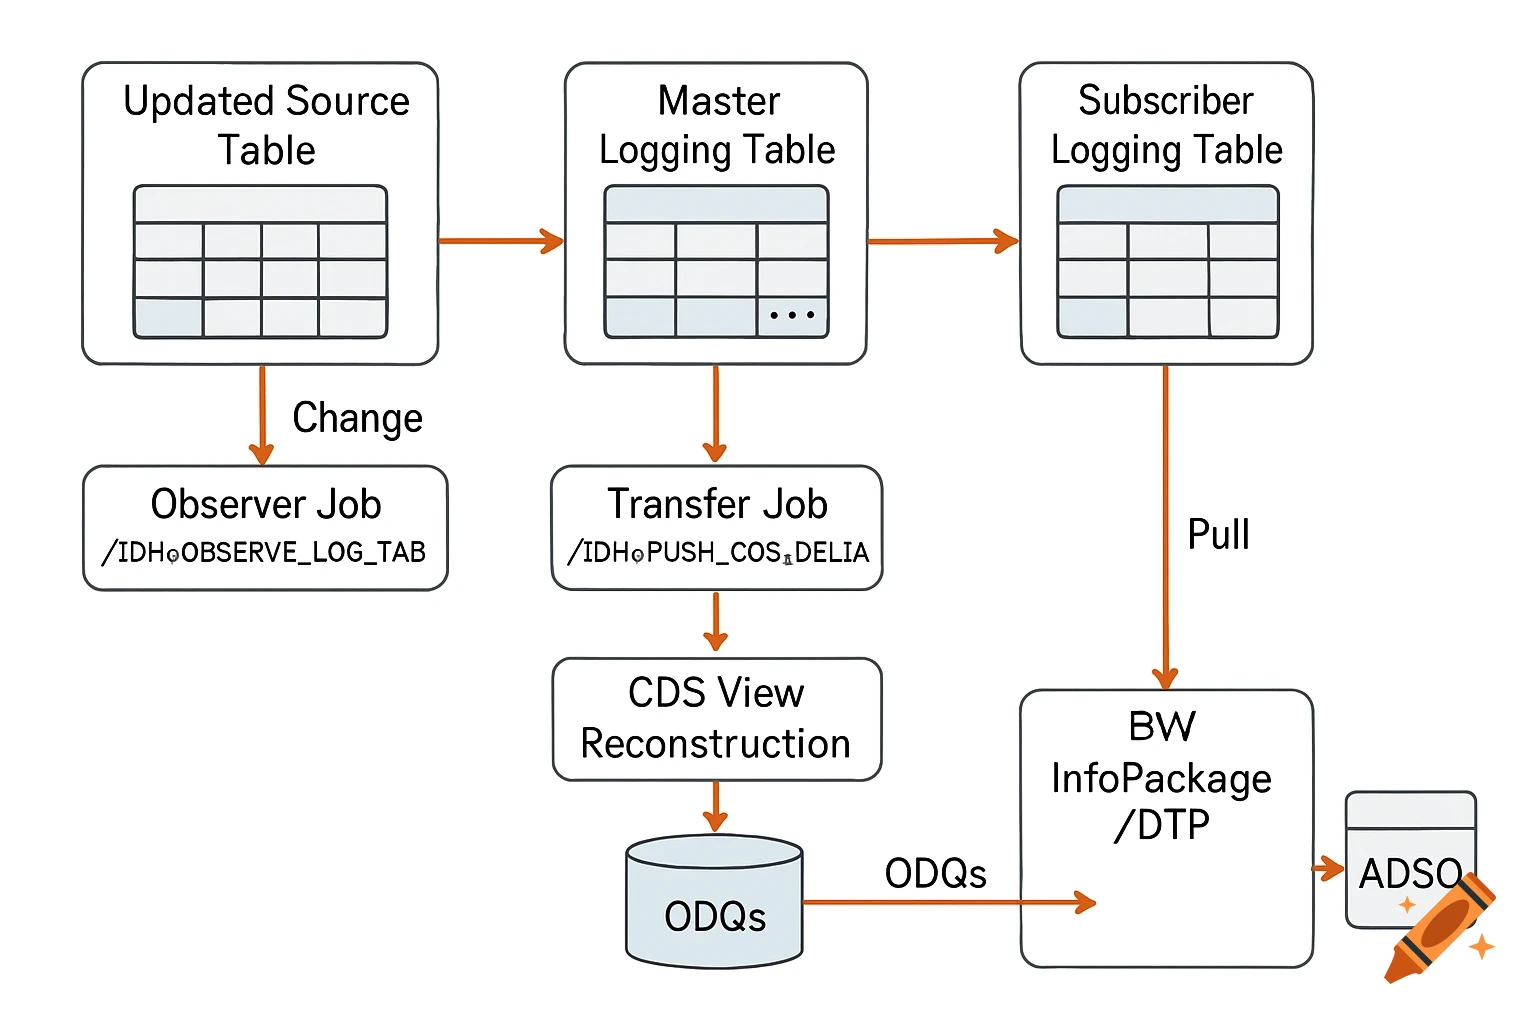
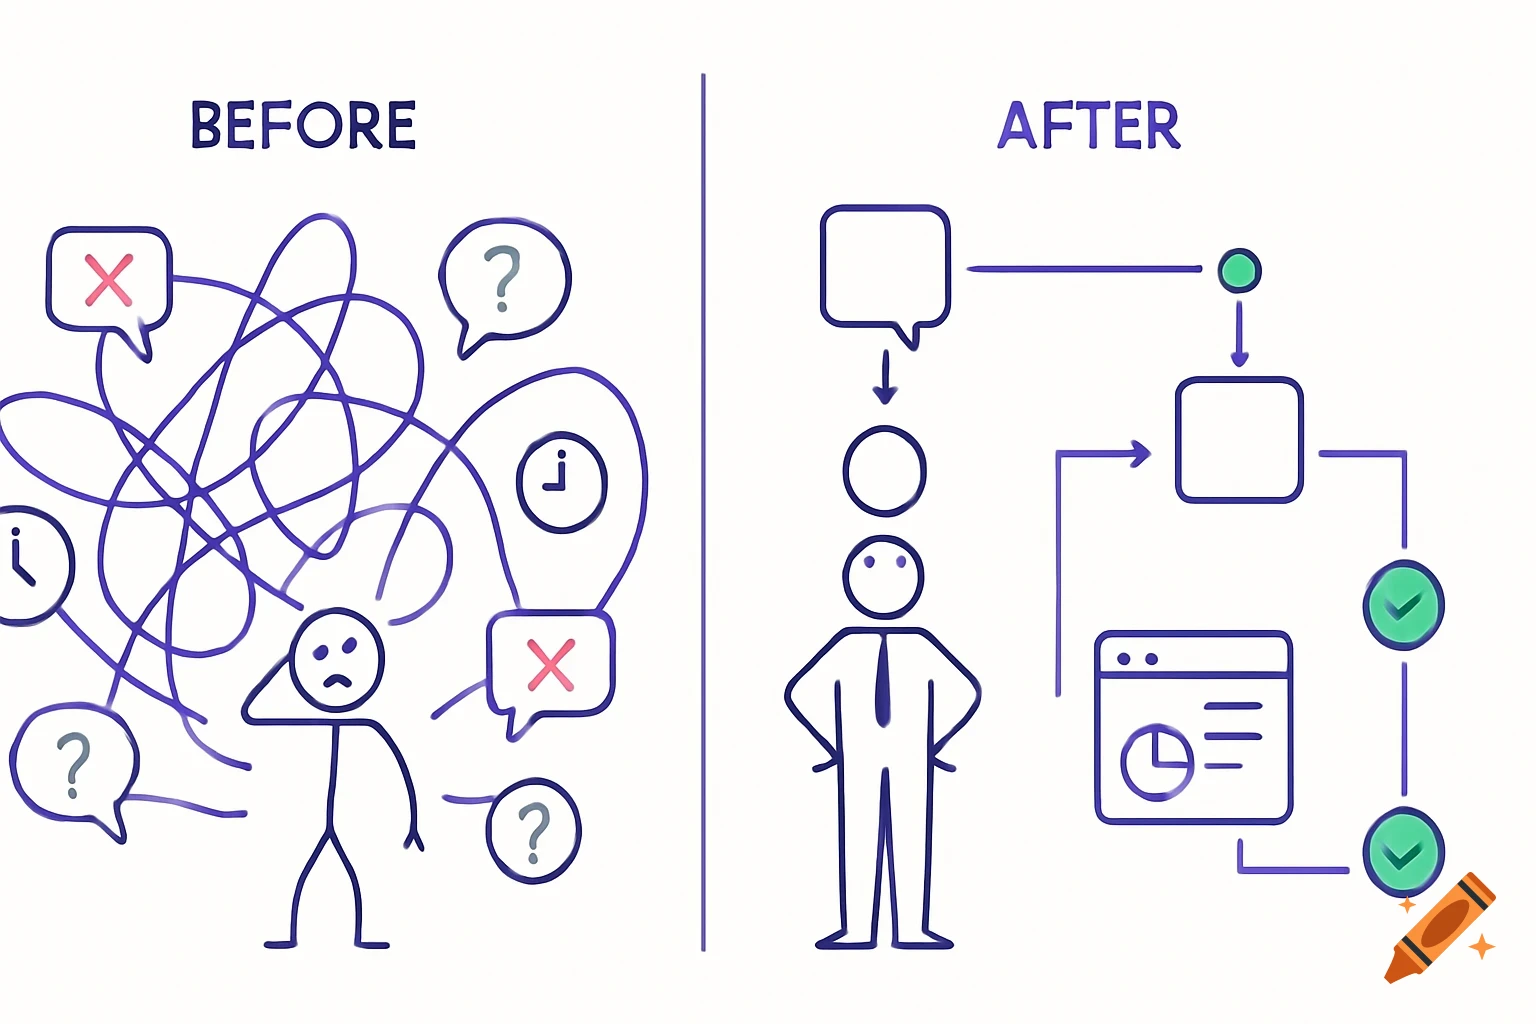
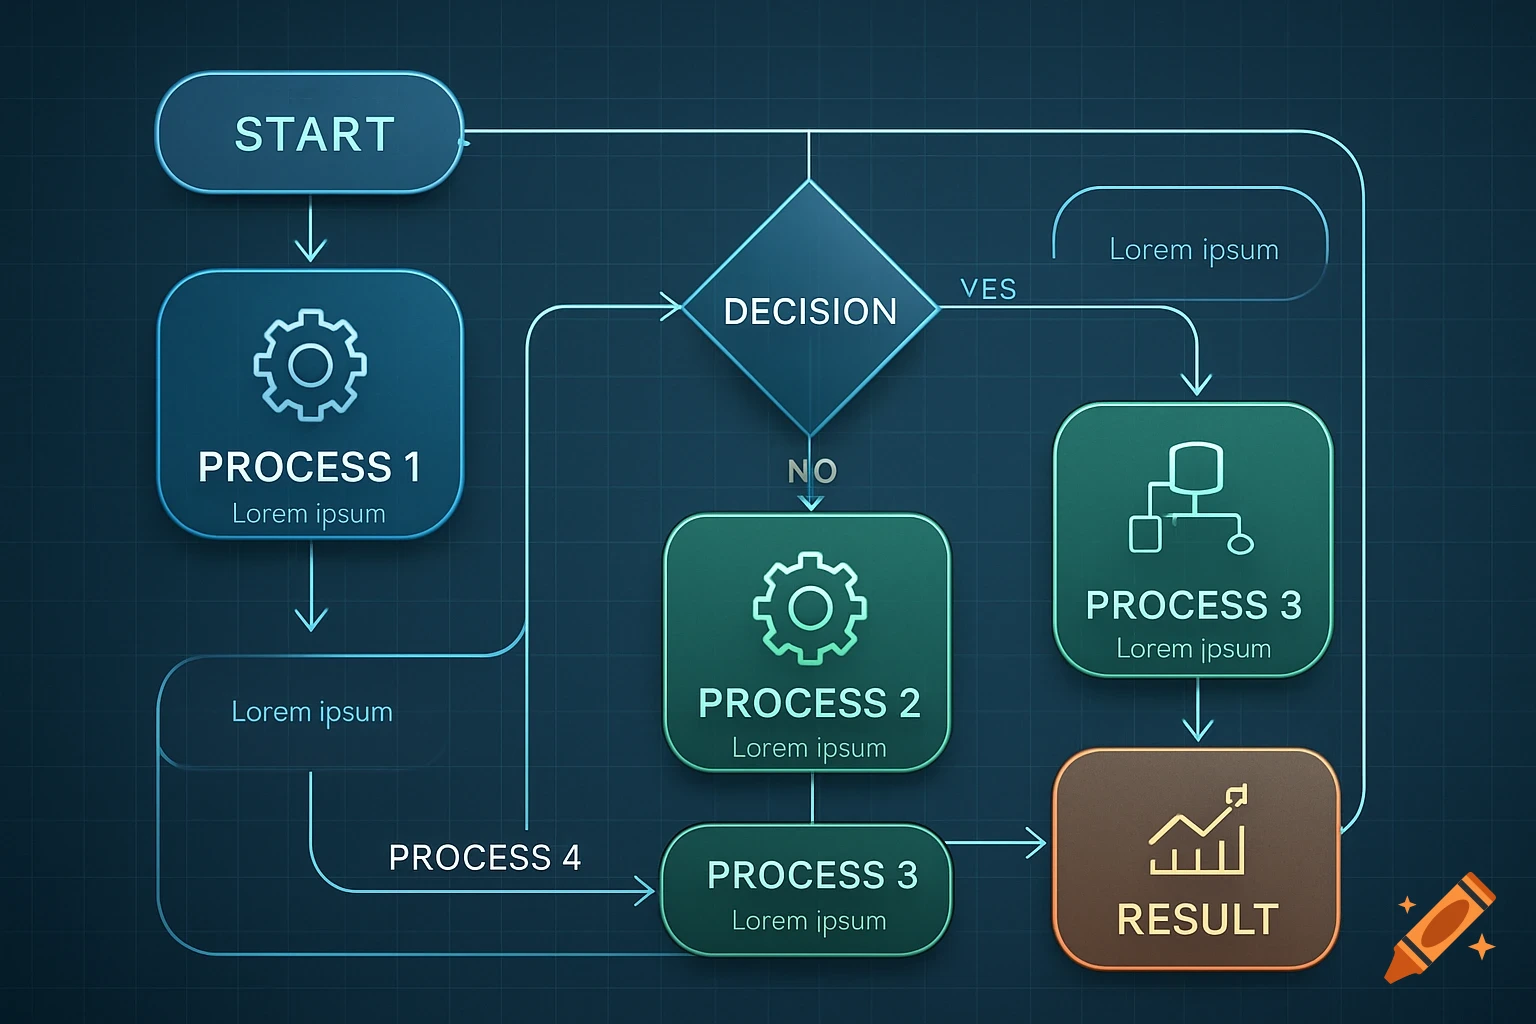
Flowchart showing data preprocessing steps with icons.
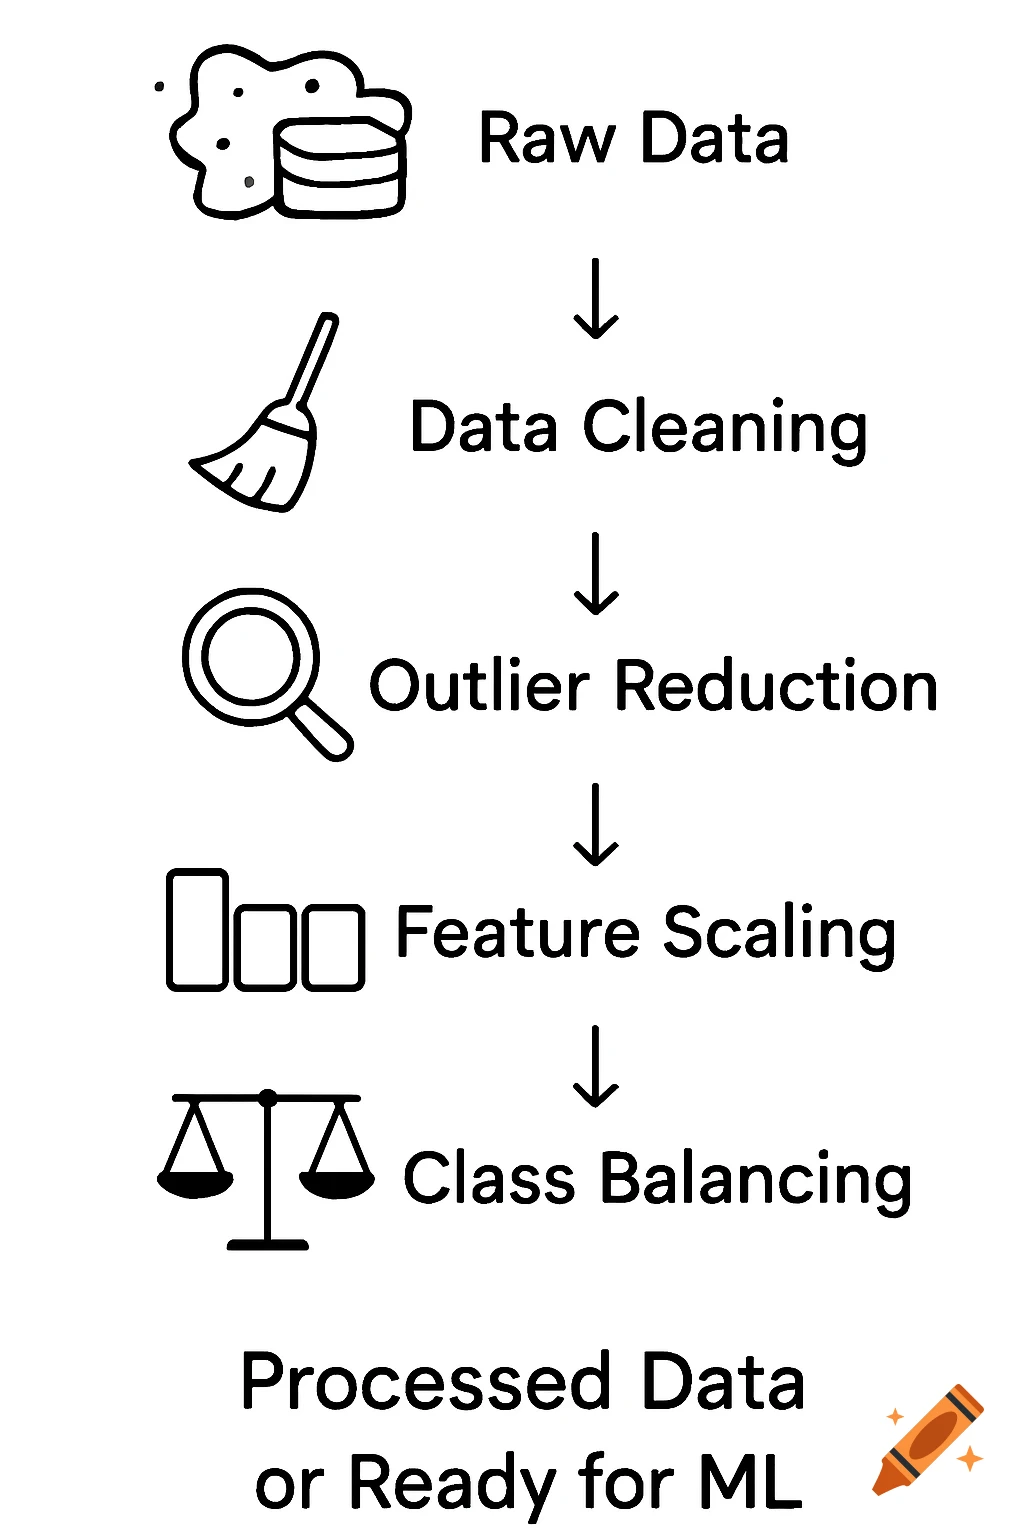
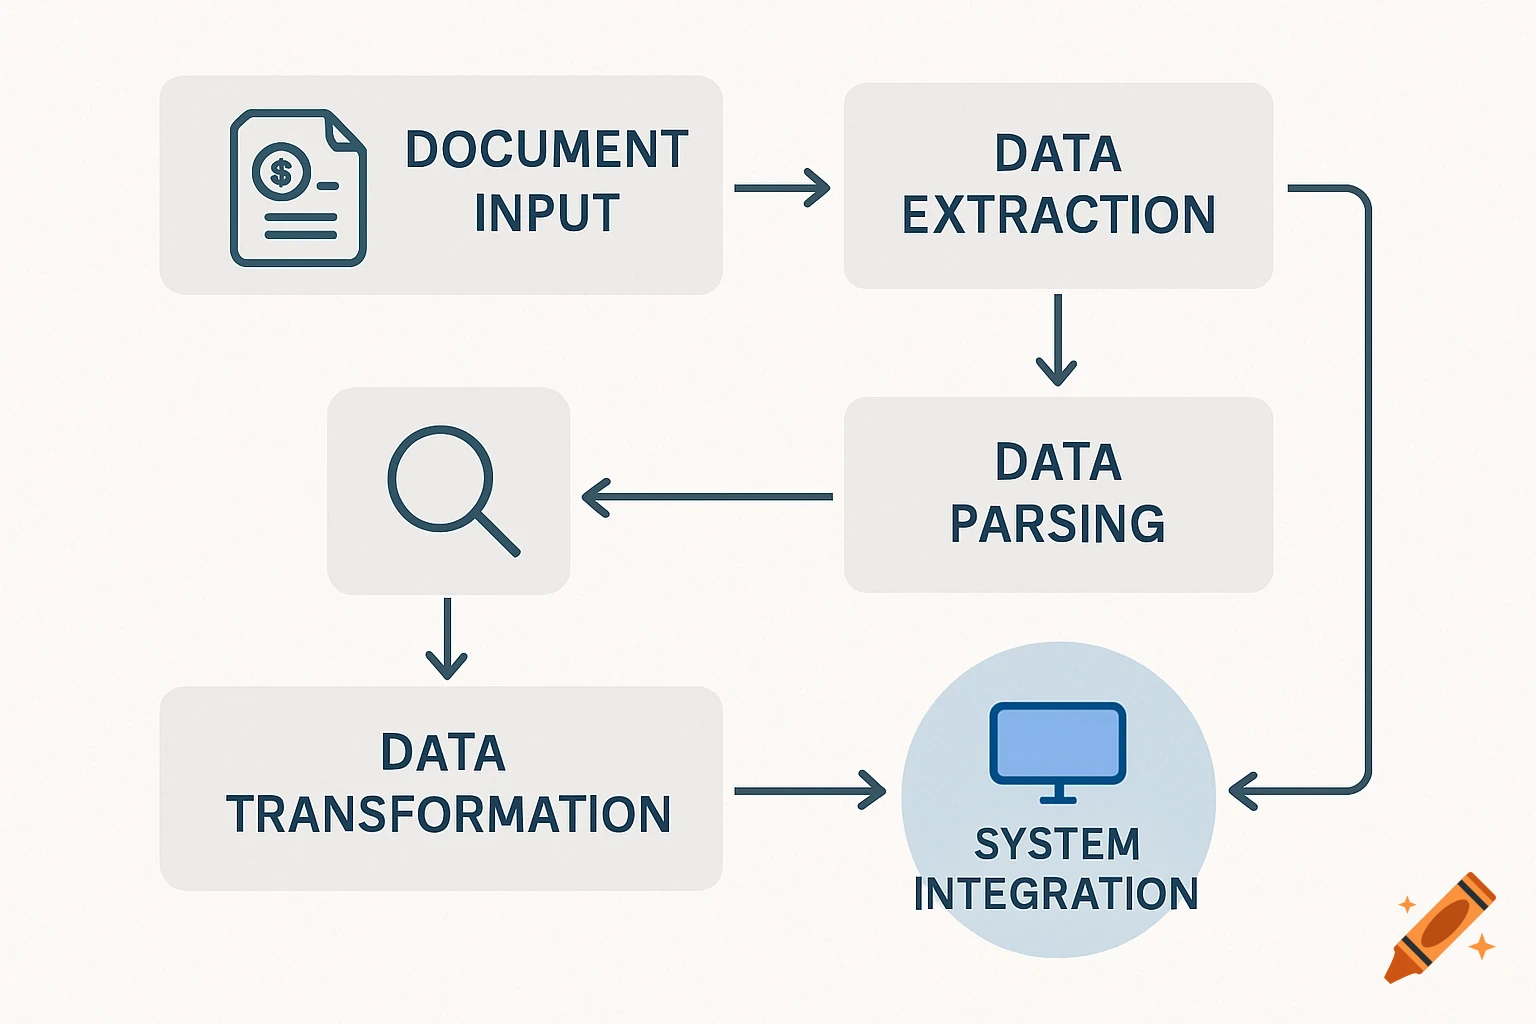
A concise flow chart or pipeline diagram illustrating the data preprocessing steps. Visual Elements: Start with an icon for "Raw Data" (e.g., a messy data cloud or a stack of coins/cards). Then, show distinct steps with arrows connecting them: "Data Cleaning" (e.g., a broom icon), "Outlier Reduction" (e.g., a magnifying glass or a filter icon), "Feature Scaling" (e.g., a balance scale or uniform blocks), and finally, "Class Balancing" (with a clear visual representation of balancing, like two uneven sides of a scale becoming even, or a visual of SMOTE creating new data points). This leads to "Processed Data" or "Ready for ML." Voir plus
More images like this