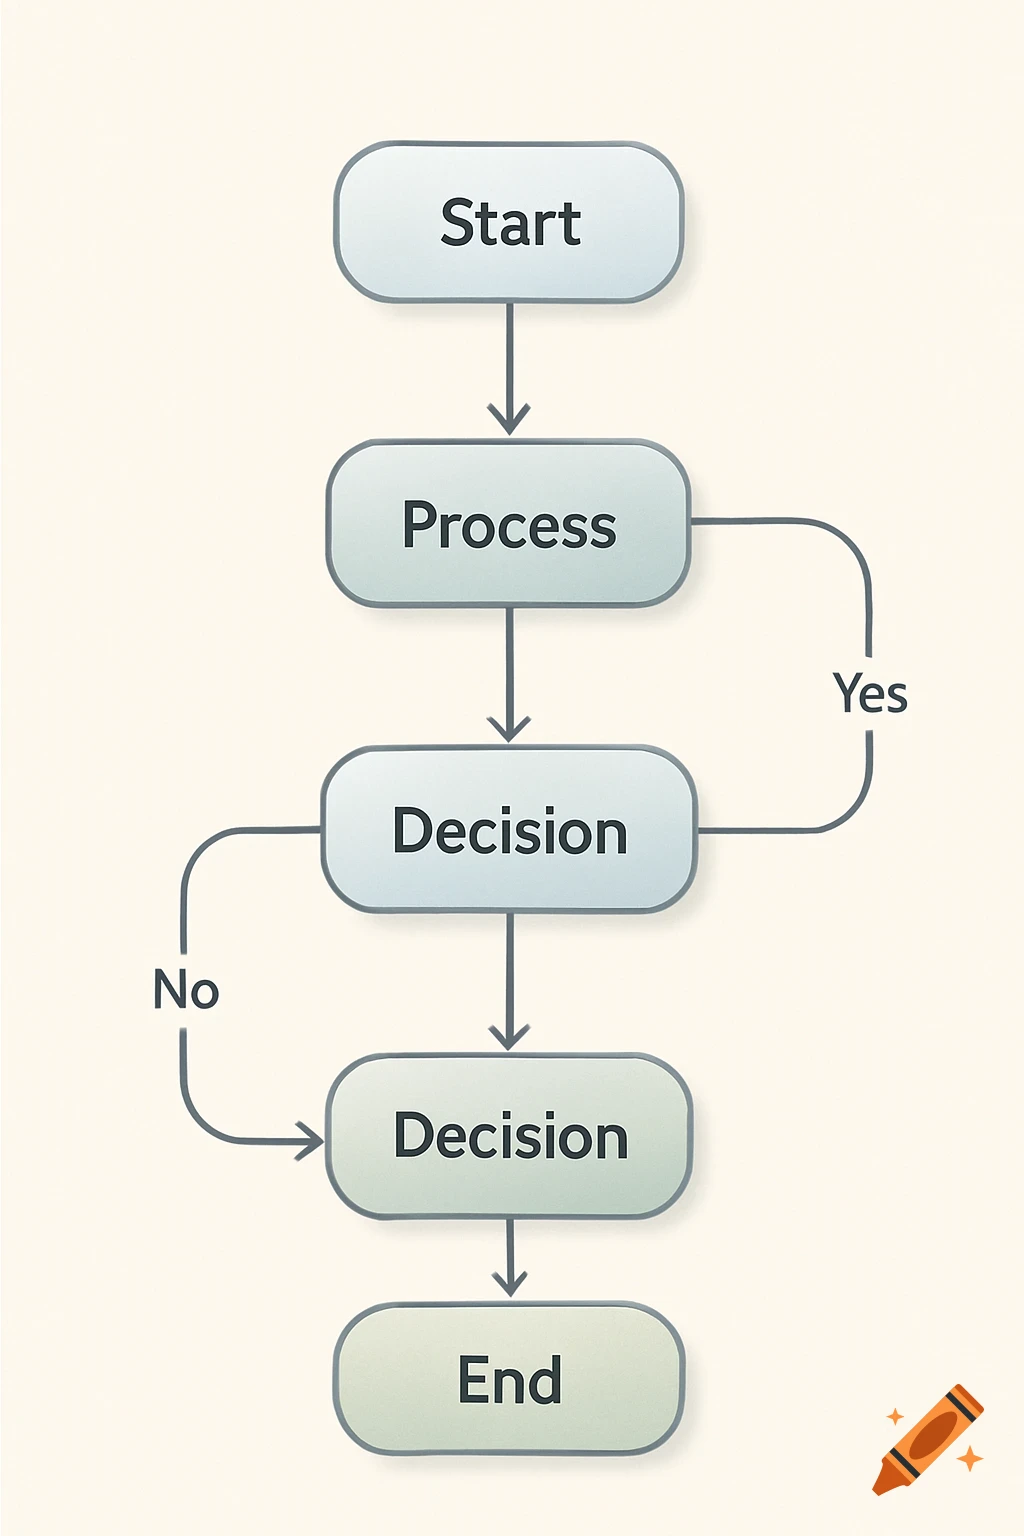
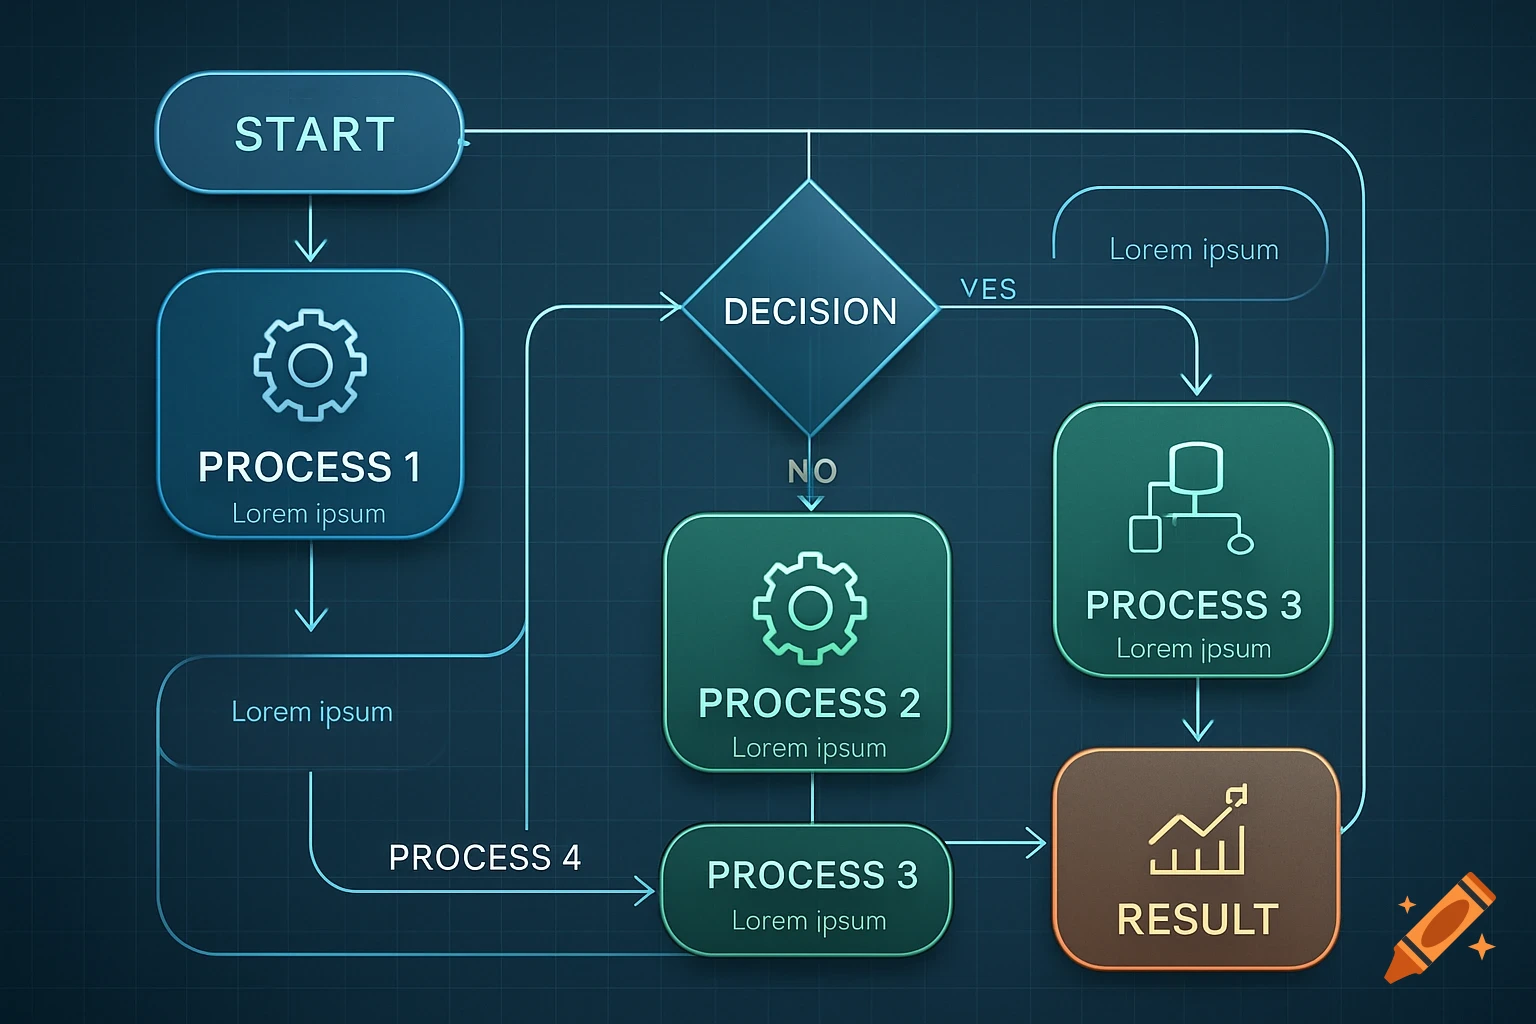
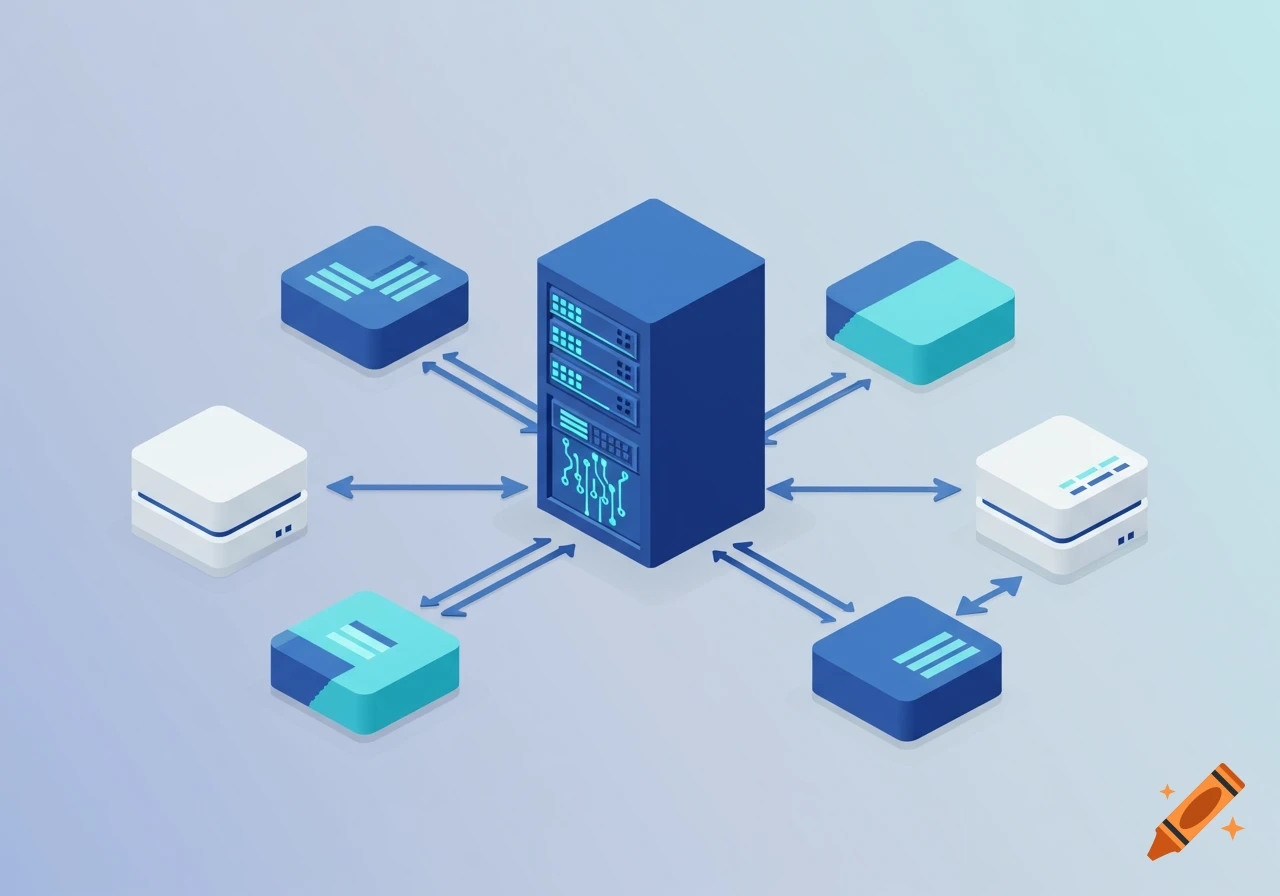
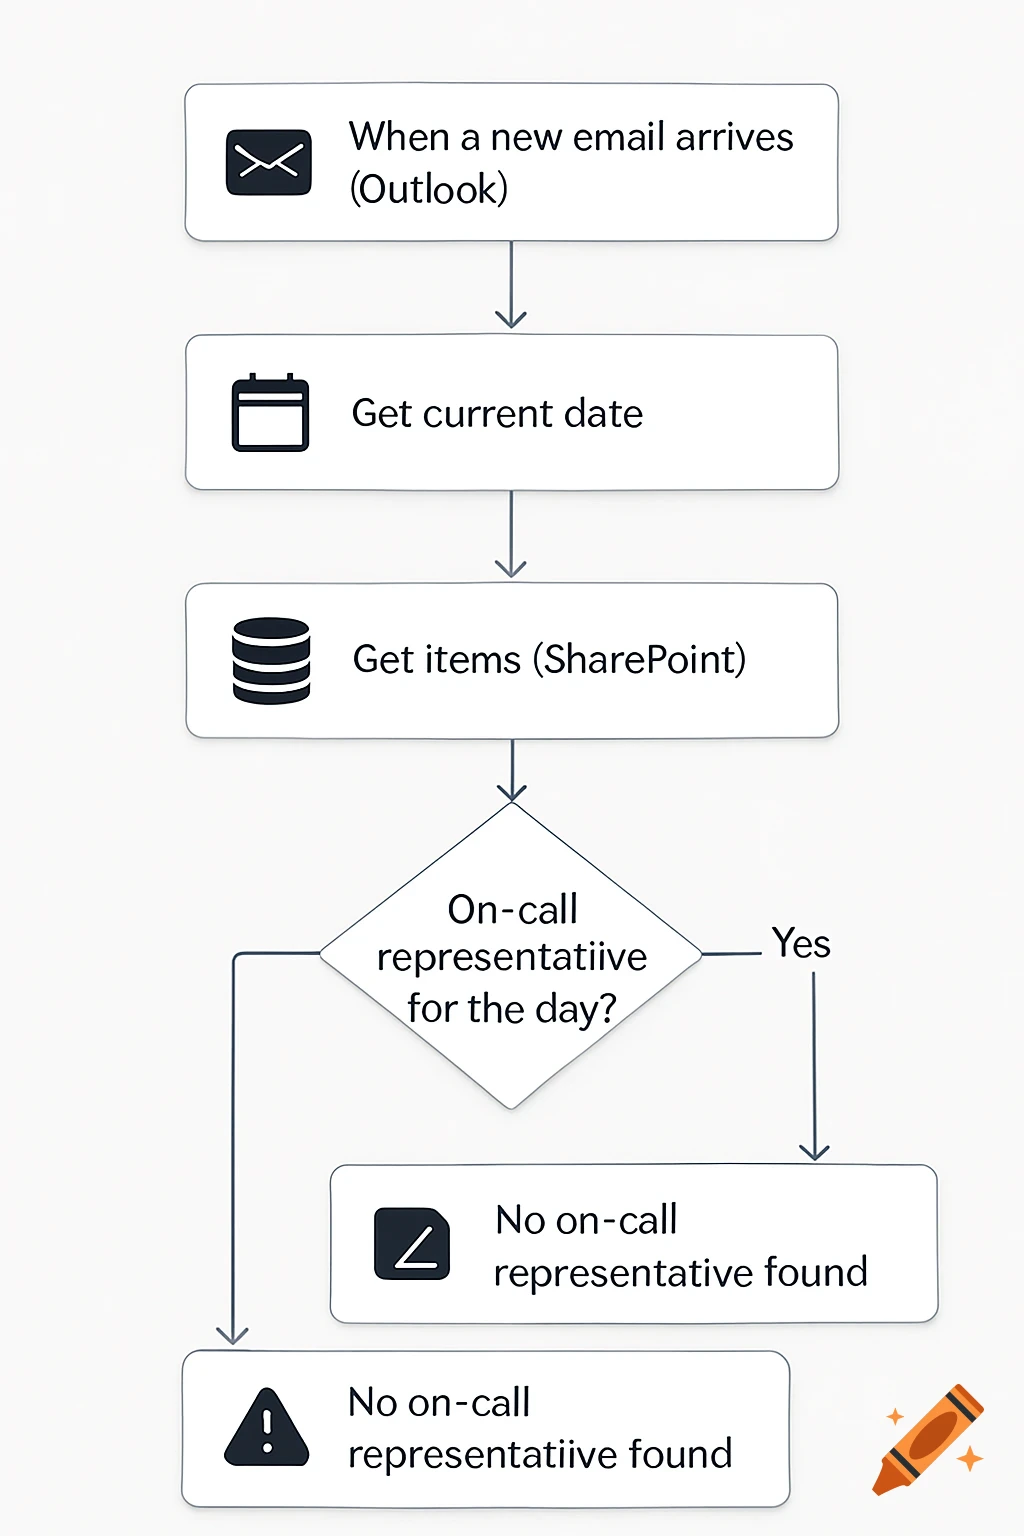
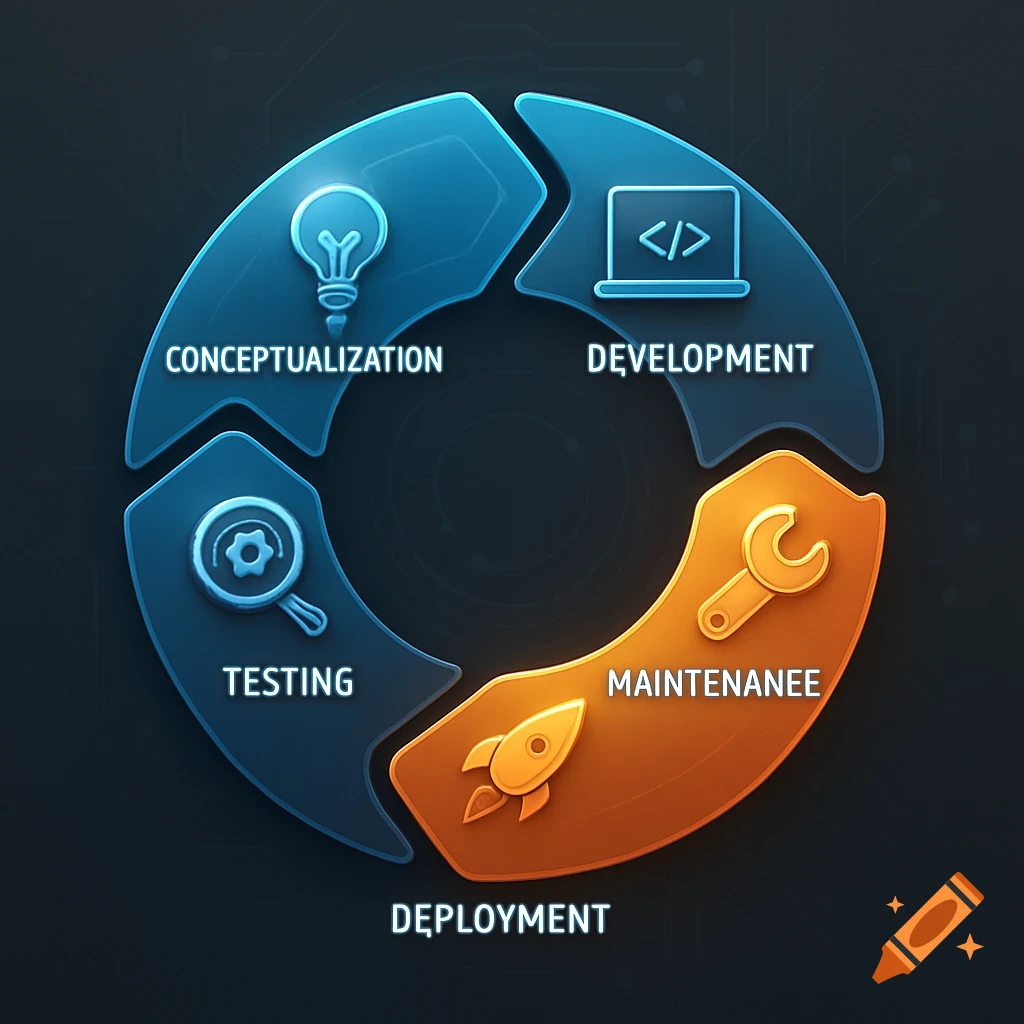
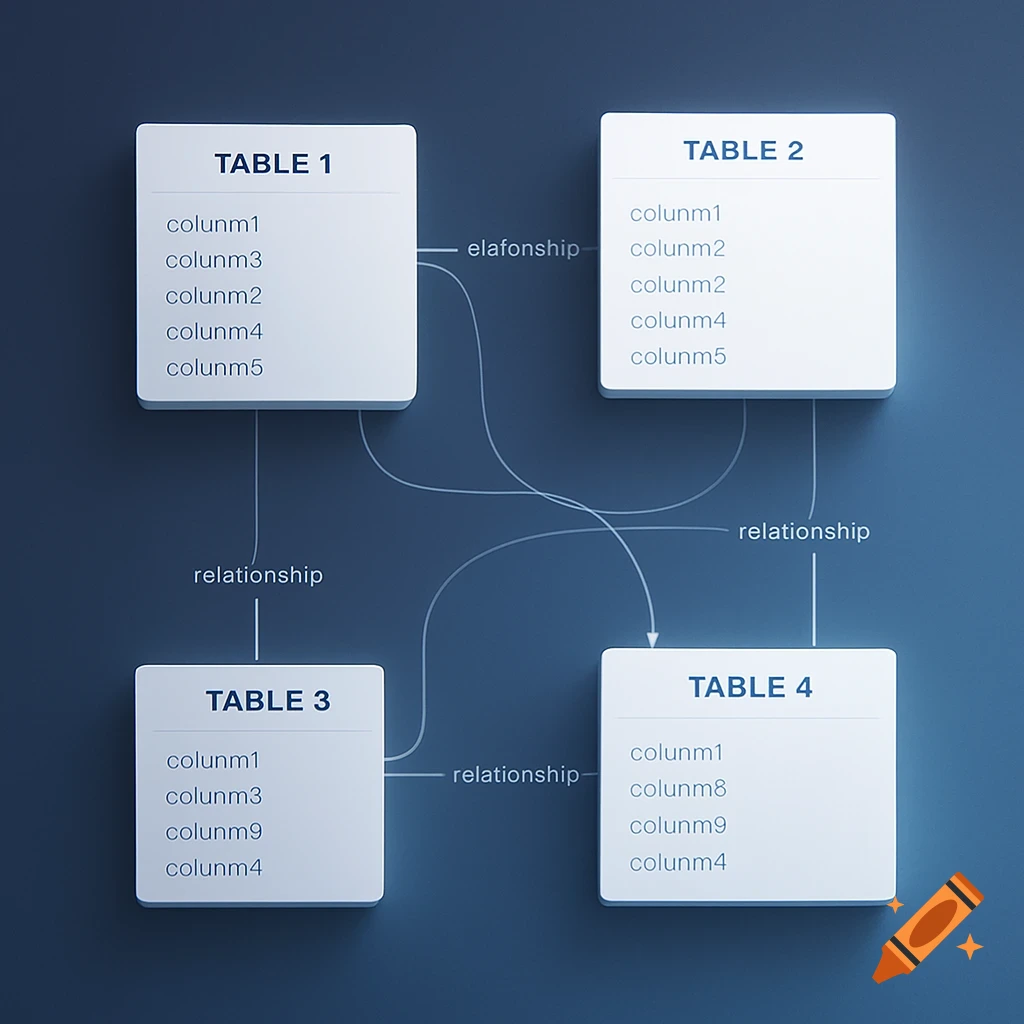
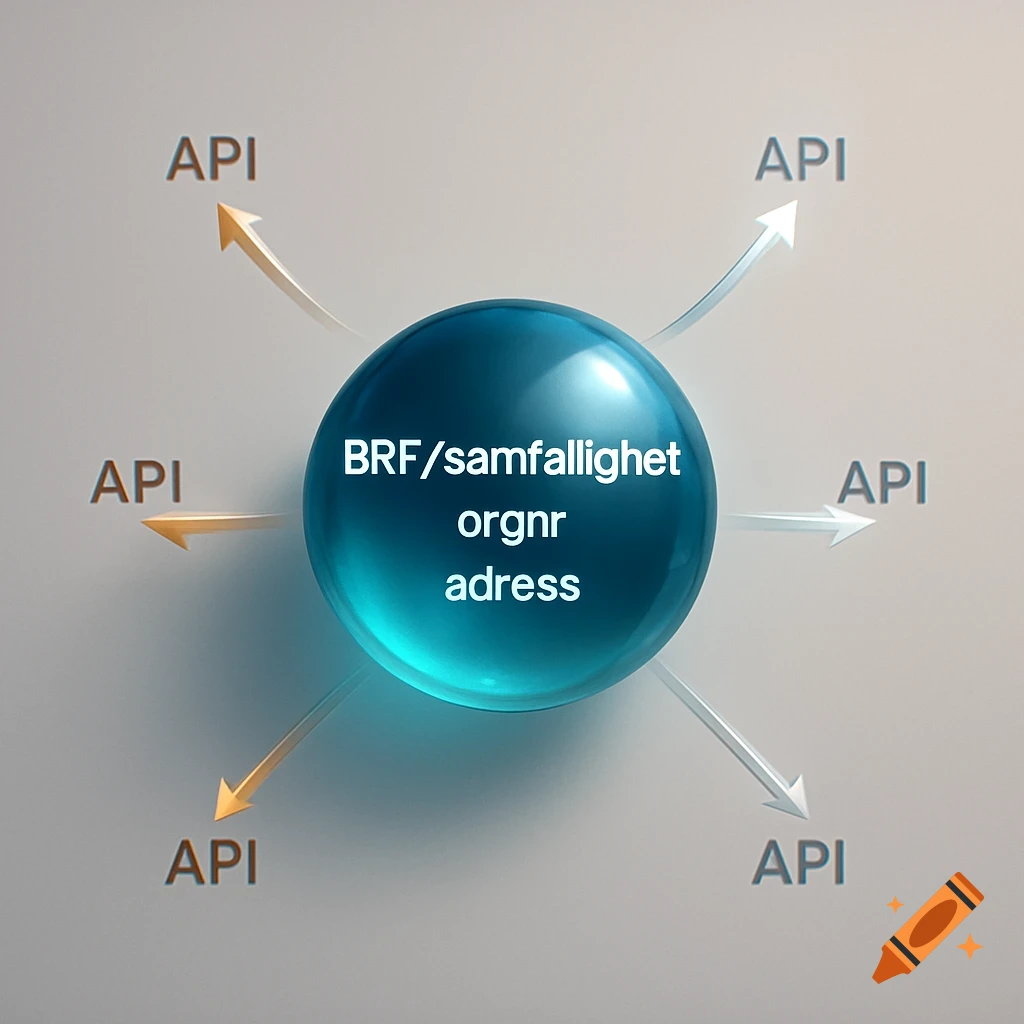
A two-stage image analysis flowchart for container damage inspection using YOLOv8 for localization and ResNet50 for classification.

Create a professional, clean flowchart illustrating a two-stage image analysis pipeline for container damage inspection. The flowchart should include the following stages: Input Image – an icon or box representing the raw image. Stage 1: YOLOv8 Object Detection – label this “Damage Localization (Bounding Boxes)” and show that it outputs cropped regions of detected damage. Stage 2: ResNet50 Classification – label this “Damage Type Classification,” taking the cropped damage regions as input. Output – a box showing the final predicted damage class. Use arrows to indicate the flow of data from one stage to the next. Include optional small notes: “Train/Validation/Test split” near Input, “Bounding Box Annotation” near YOLOv8. Use minimal colors, clean lines, and a professional style suitable for a thesis figure. Voir plus
More images like this