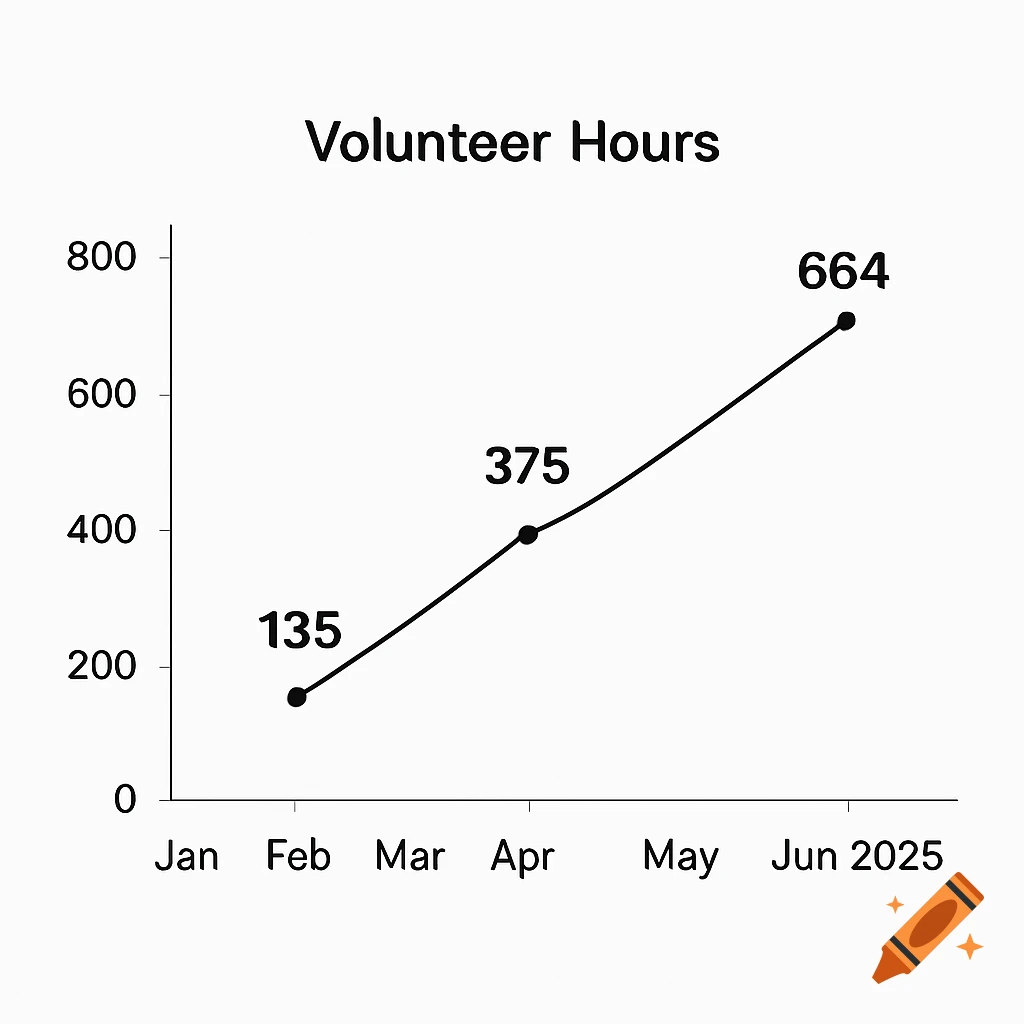
A line graph titled "Frequency of Smartphone Checks During Work Hours (Oct 2–10, 2023)" showing daily smartphone checks from Oct 2 to Oct 8 and Oct 10.

Notes for Graph Inclusion (to insert in your document): Create a line graph with the x-axis labeled with dates (Oct 2, Oct 3, etc.). The y-axis labeled “Number of Phone Checks,” scaled from 0 to 25. Plot points for each day: 15, 14, 20, 17, 12, 16, 15. Connect points with lines to show trend. Title the graph: "Frequency of Smartphone Checks During Work Hours" Include figure number and caption in APA format below the graph. Title: “Frequency of Smartphone Checks During Work Hours (Oct 2–10, 2023)” X-axis: Dates (formatted as dates if possible) Y-axis: Number of Phone Checks (scale from 0 to 25 for clarity) Add data markers on points Remove gridlines if desired for simplicity Step 4: Format for APA Style Use a clear, readable font such as Times New Roman or Arial. Axis labels should be concise and include units if relevant. Voir plus
More images like this