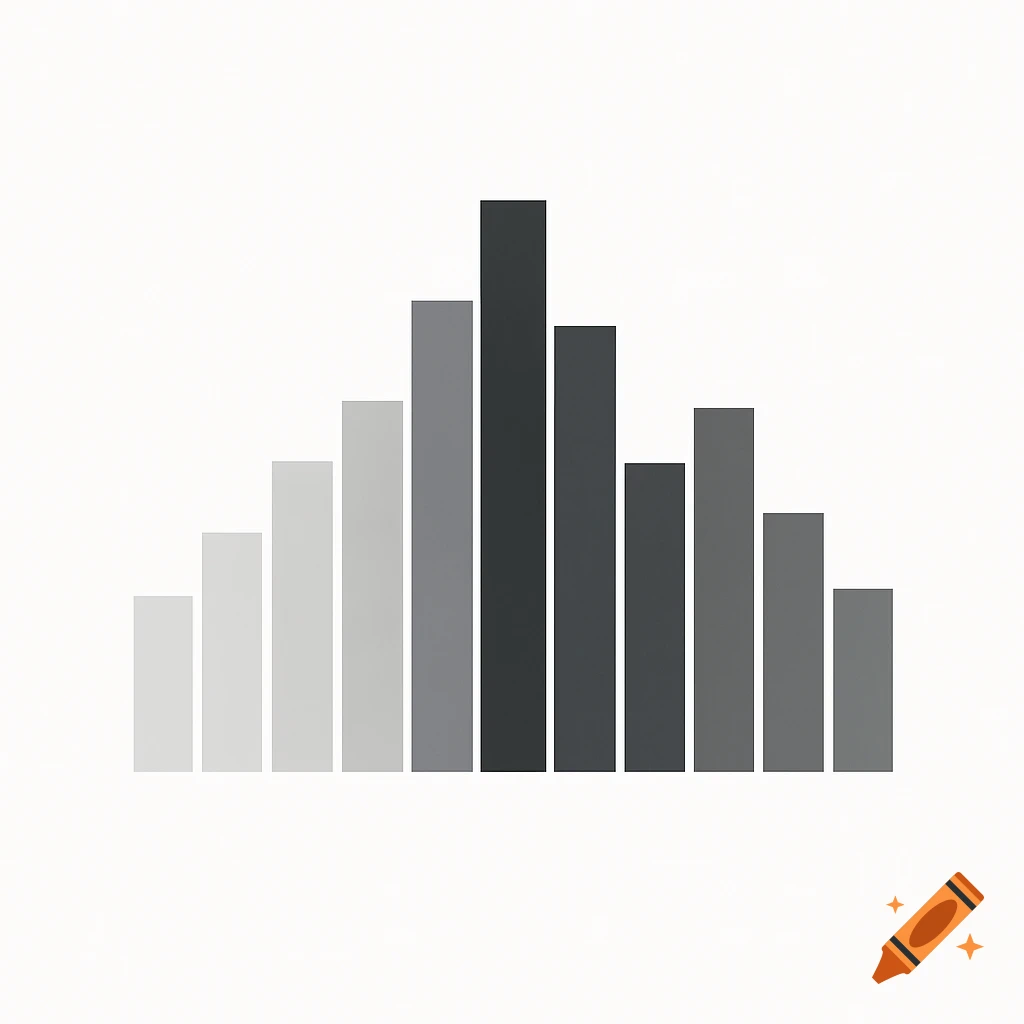
A normal distribution curve graph showing density on the Y axis and sample mean price on the X axis. The peak is above 1779.43. The area to the right of 1779.43 is shaded and labeled 99;99%. The mean is labeled as mu_X = 1779.43.

3b. Probability sample mean > 1535 Visual Aid Description: Draw a smooth bell-shaped curve specifically for the sampling distribution of the mean. This curve will be narrower and taller than the curve for individual prices from 2a and 2b, reflecting the smaller standard error. Horizontal Axis (X-axis): Label this "Sample Mean Price ( X ˉ )" and include relevant numerical markings. Vertical Axis (Y-axis): Label this "Density" or "Frequency". Mean: Mark the location of the mean of the sampling distribution (μ X ˉ , which is equal to your population mean, e.g., 1779.43) on the horizontal axis directly under the peak of the bell curve. Boundary: Mark the value 1535 on the horizontal axis. This point will be to the left of the mean. Shaded Area: Shade the entire region under the curve that lies to the right of the vertical line drawn up from 1535 to the curve. This shaded area represents the probability that a sample mean is greater than 1535. Labels: Clearly label the mean of the sampling distribution (μ X ˉ ) and the boundary (1535) on the horizontal axis. Label the shaded area with the calculated probability (e.g., "99.99%"). (Imagine a normal distribution curve (narrower than the previous ones) with the area to the right of 1535 highlighted.) Voir plus
More images like this