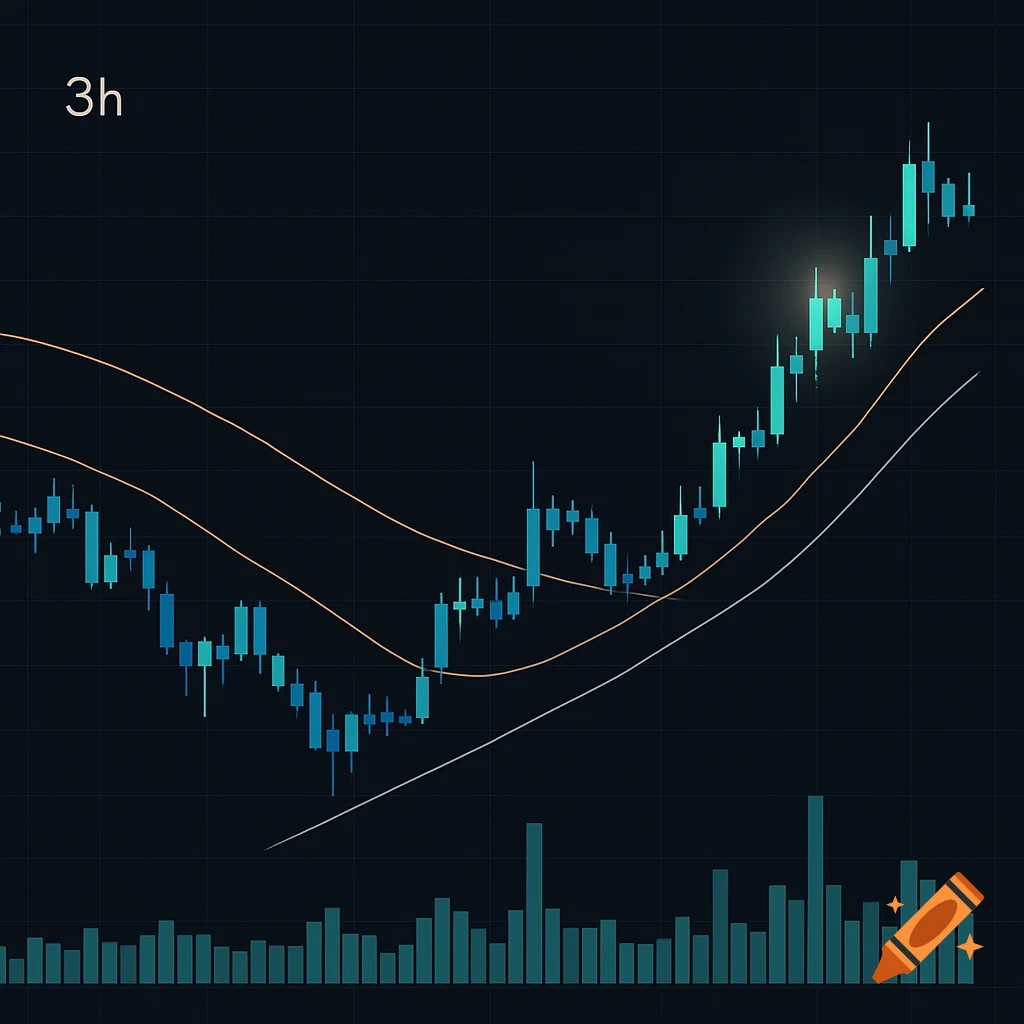
A vibrant financial chart displaying EMA 9, EMA 21, RSI, and candlestick patterns against a dark background.
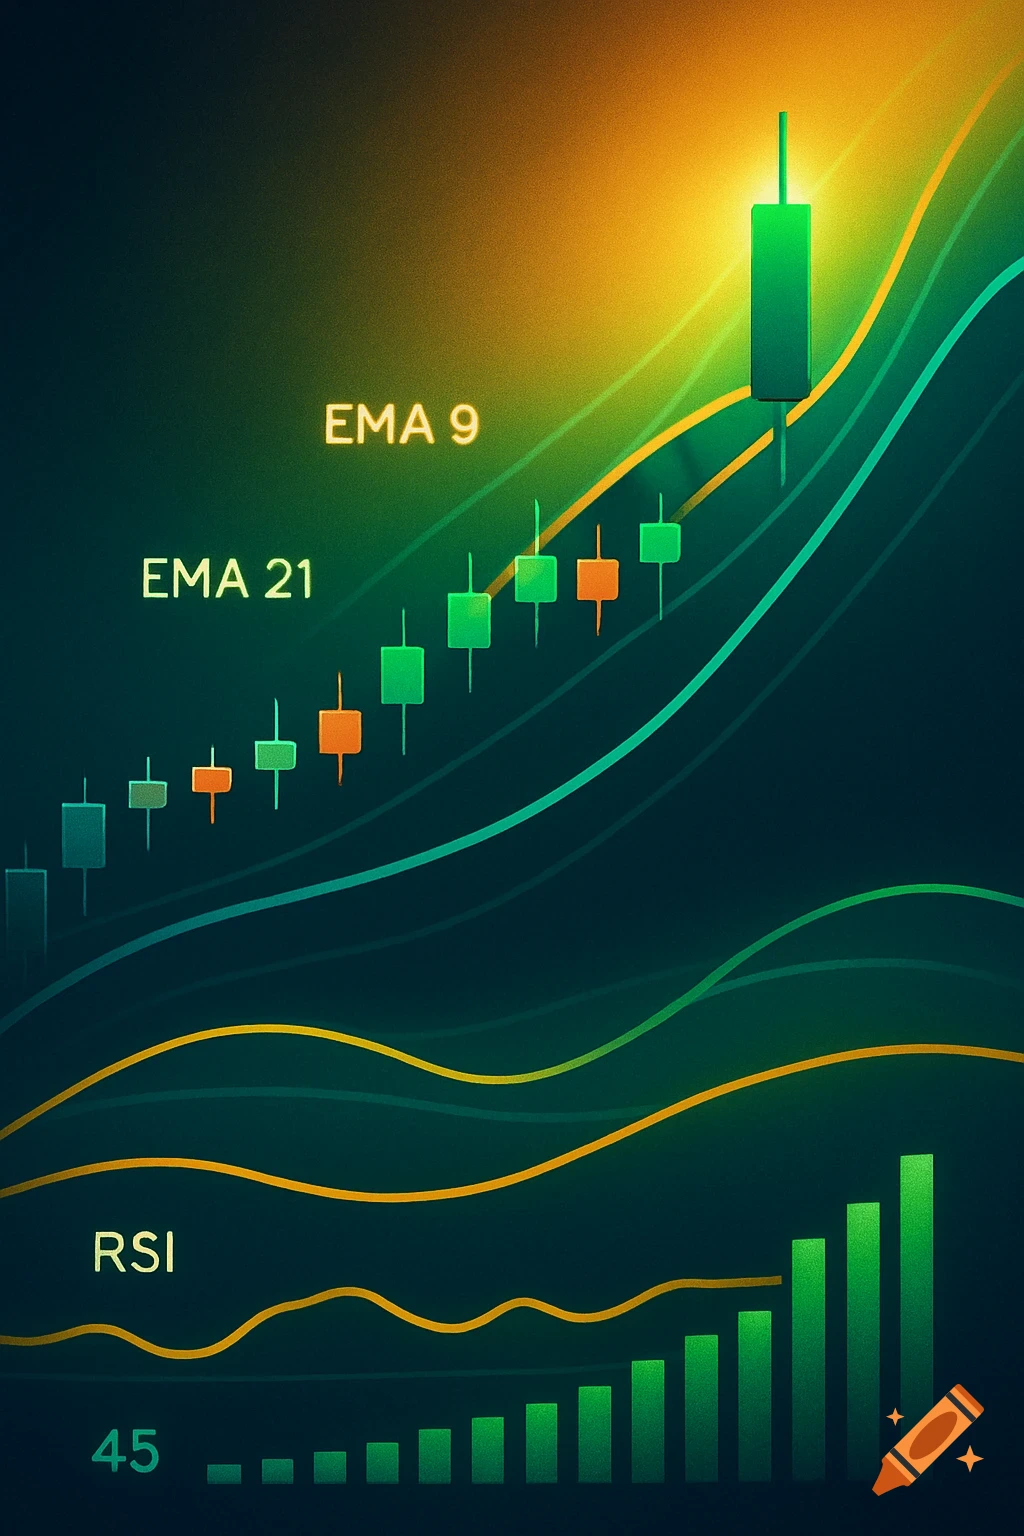
1. EMA 9 crosses ABOVE EMA 21 2. Candle closes above both EMAs 3. RSI between 45 – 60 (not overbought) 4. Volume green and increasing 5. Price pulls back to EMAs and shows a rejection wick (this is the entry) Ver más
More images like this