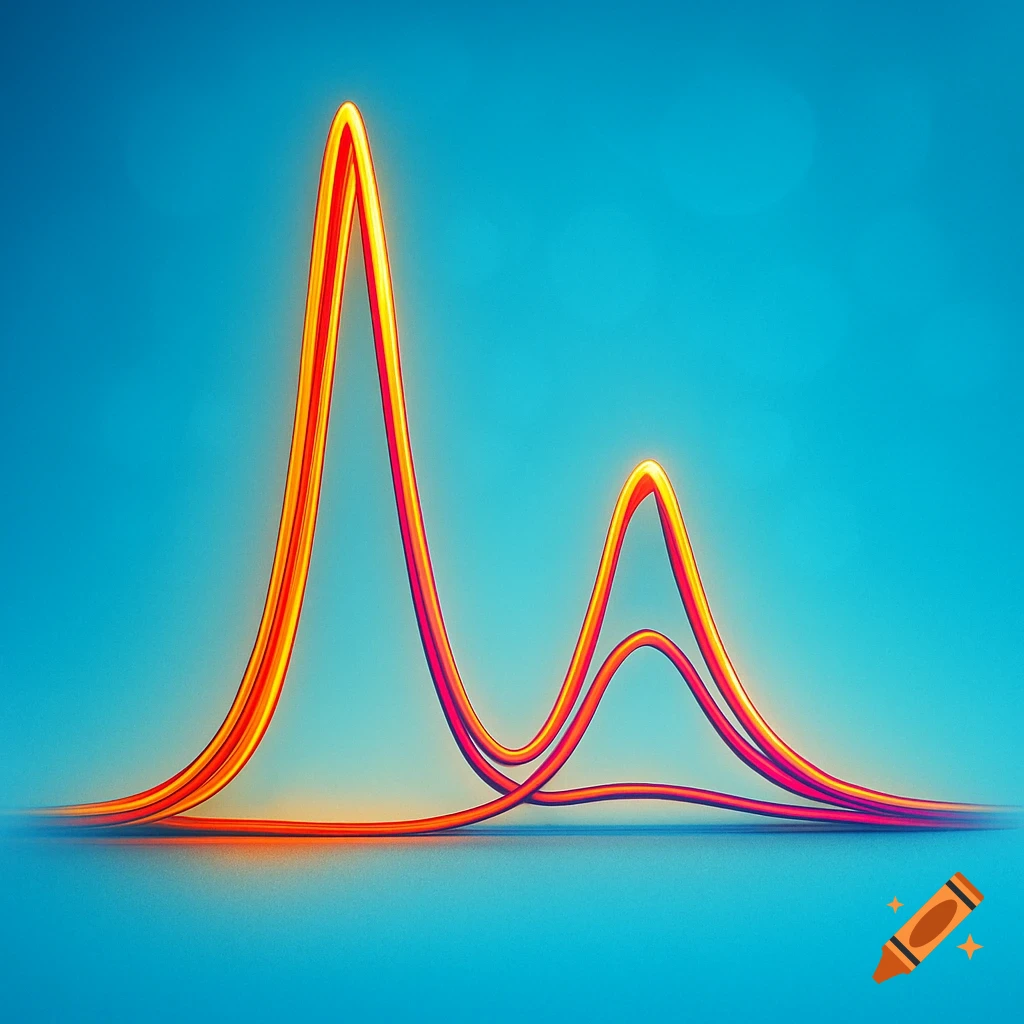
A white background graph with black axes labeled Q squared and R, and a point labeled Q at the origin. Three curved lines are plotted, two in the top right quadrant and one in the bottom left.

Text‑based graph description since images aren’t allowed: Demand downward sloping; MR below it; MC upward sloping; MR=MC determines Q\; price is found on demand at Q\. Ver más
More images like this