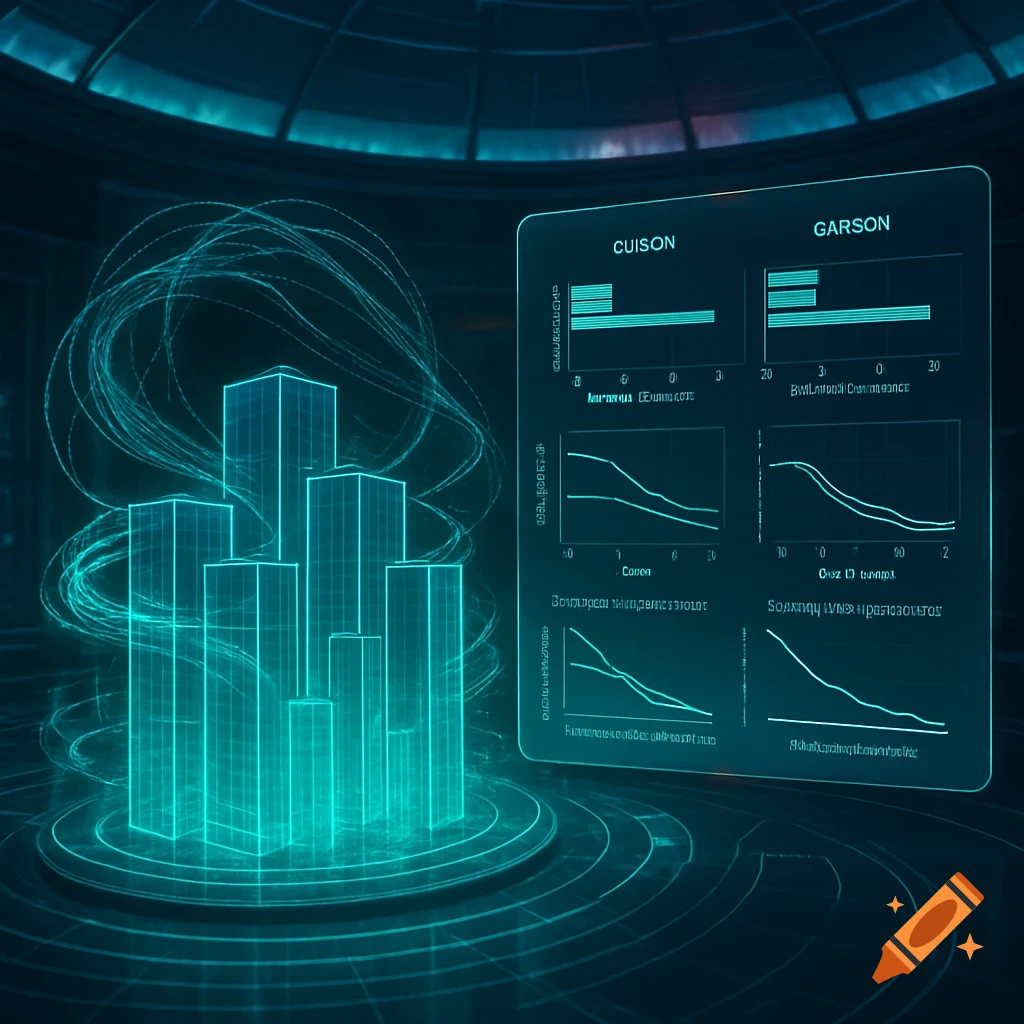
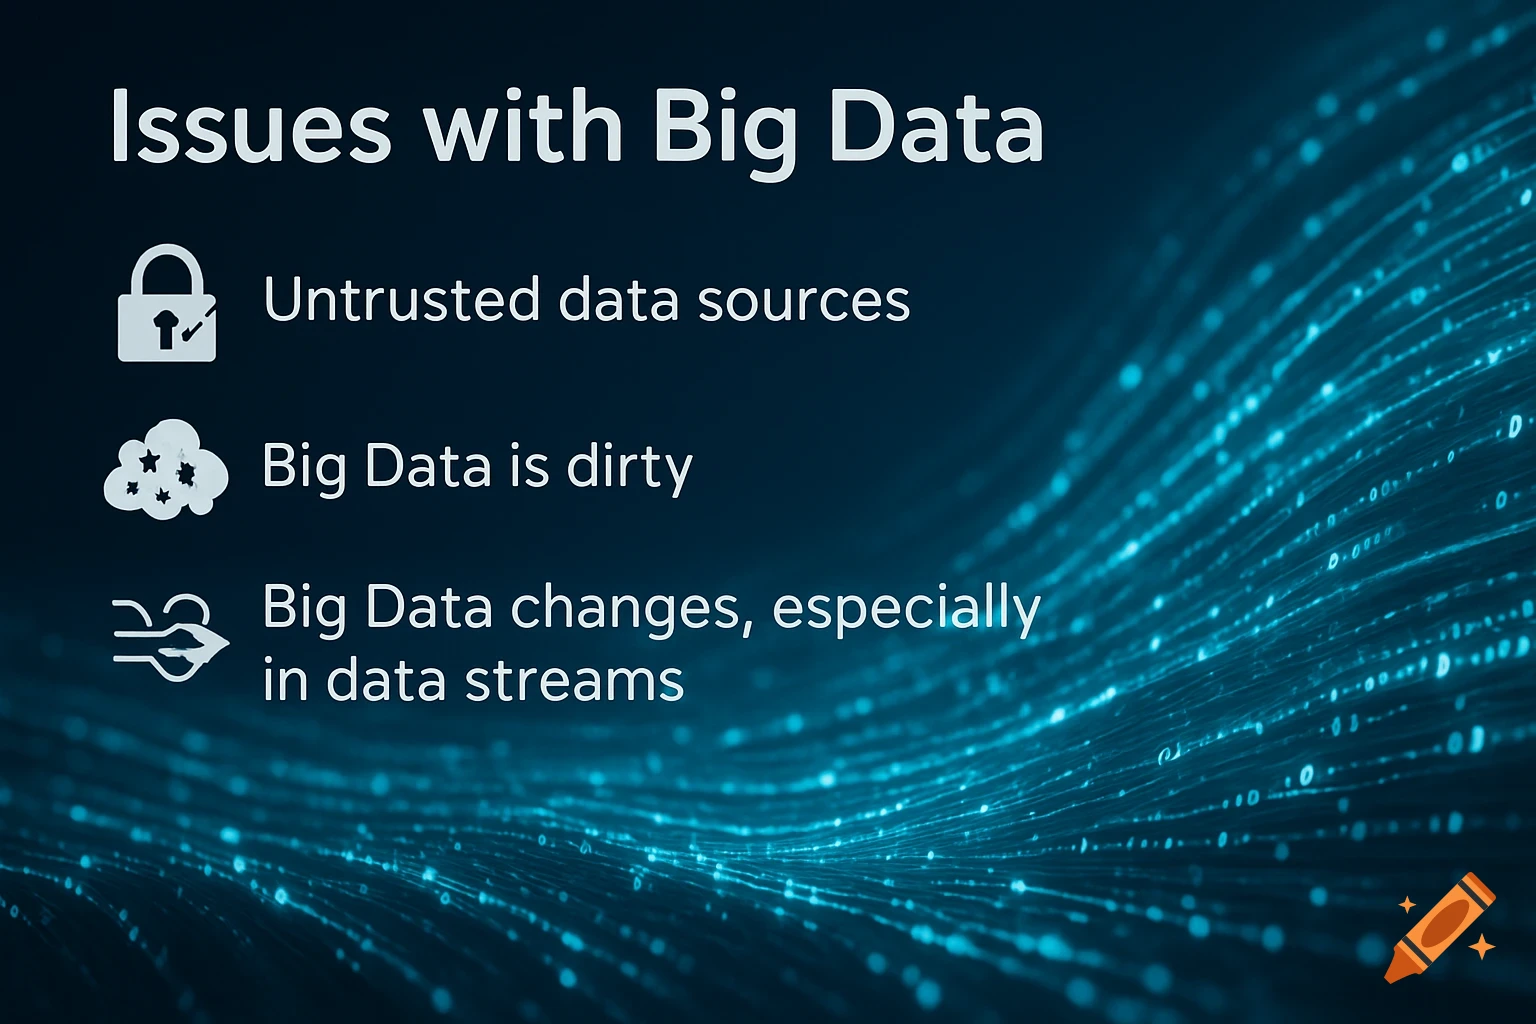
Modern analytics web dashboard UI for Notion RAG Observability with dark mode and data visualizations.
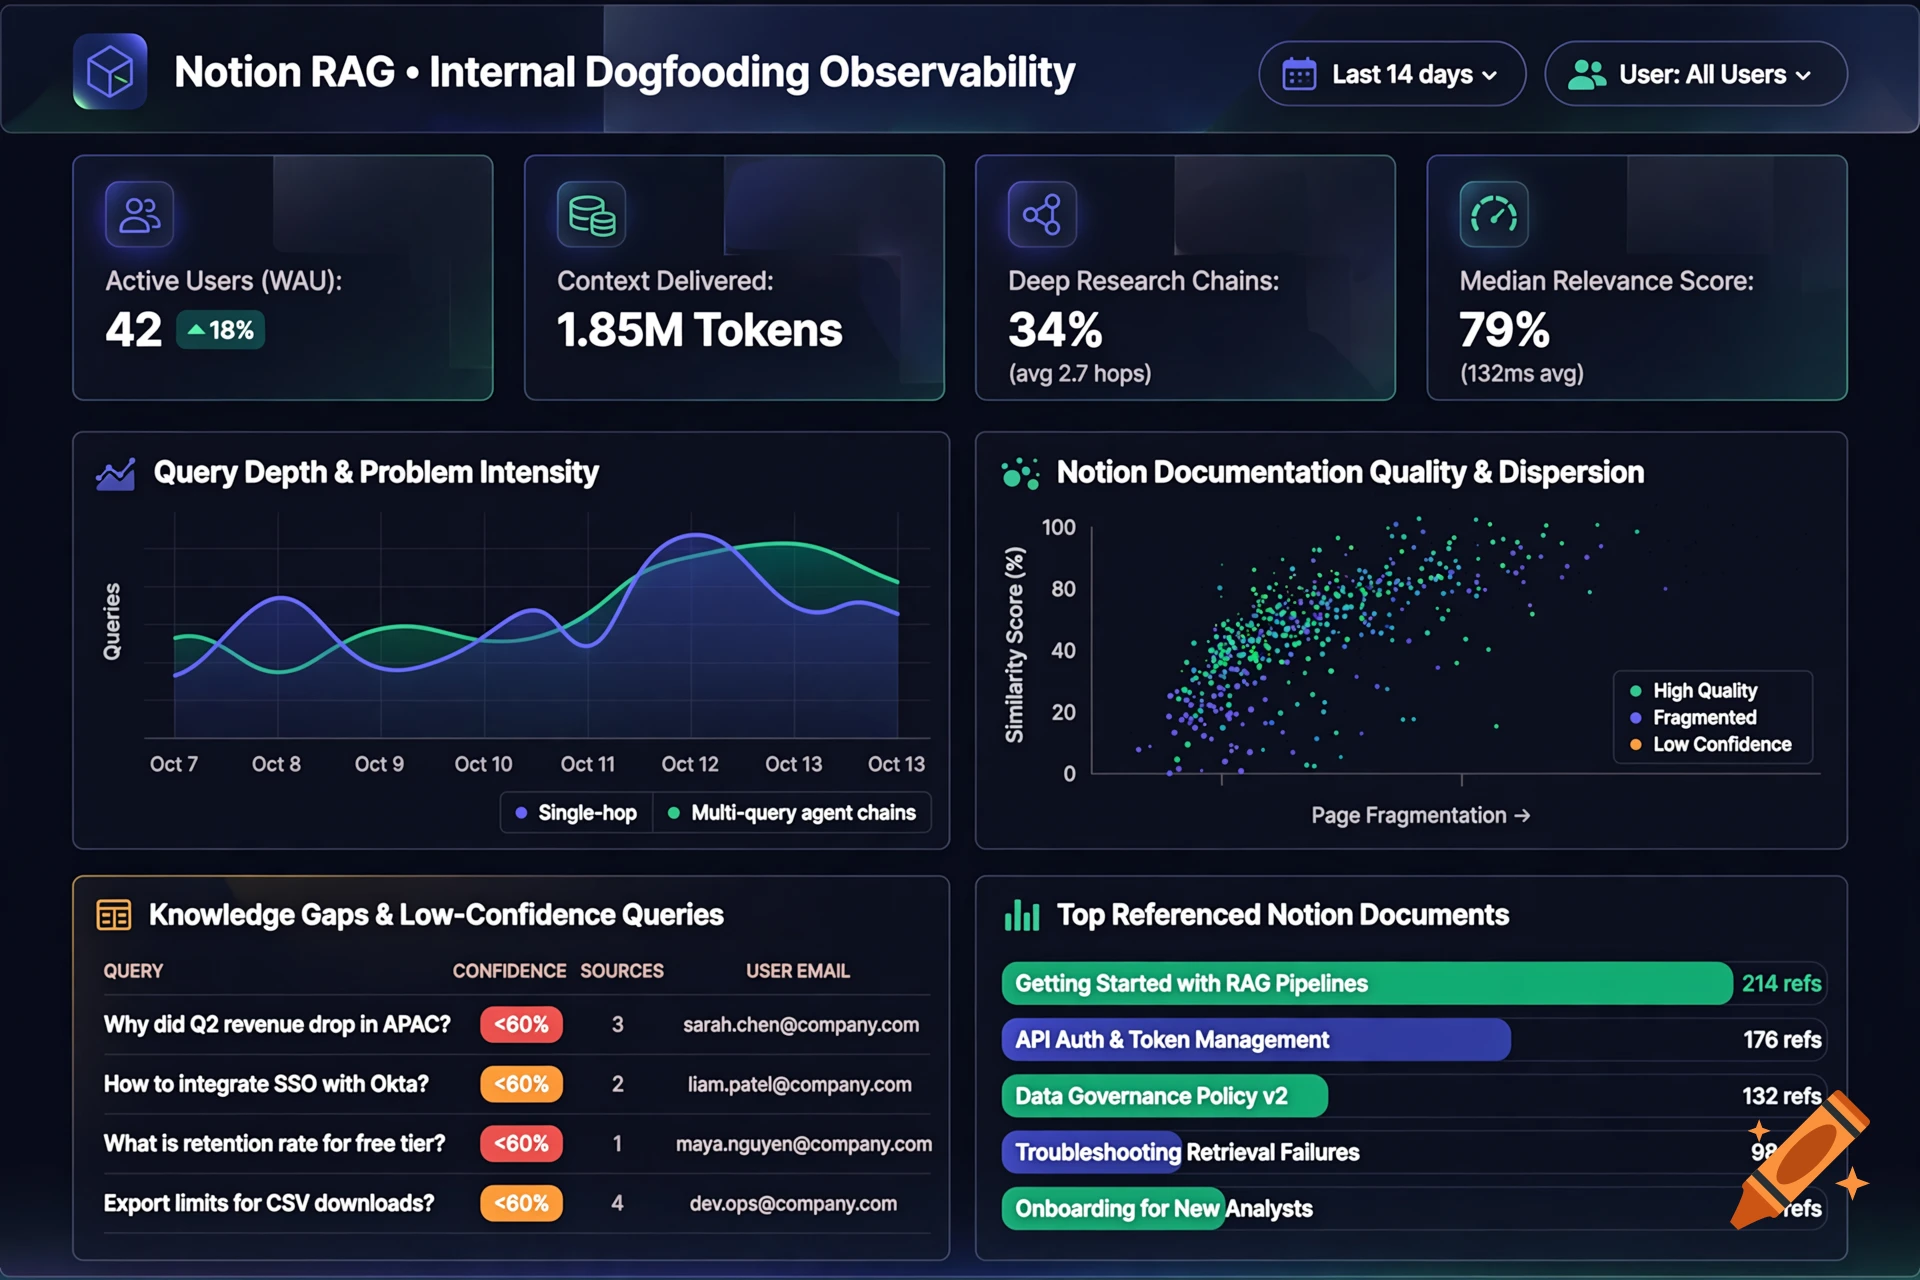
A sleek, modern analytics web dashboard UI for 'Notion RAG Observability & Retrieval Health'. Dark mode theme with deep slate navy background (#0b0f19), glowing indigo and emerald accents. Clean SaaS UI layout with no device frame. Top header shows 'Notion RAG • Internal Dogfooding Observability' with time range picker and user filter. Top row features 4 KPI stat cards: 'Active Users (WAU): 42 (+18%)', 'Context Delivered: 1.85M Tokens', 'Deep Research Chains: 34% (avg 2.7 hops)', 'Median Relevance Score: 79% (132ms avg)'. Middle row has two charts: on the left, a chart titled 'Query Depth & Problem Intensity' showing single-hop vs multi-query agent chains over time; on the right, a scatter chart titled 'Notion Documentation Quality & Dispersion' mapping similarity score against page fragmentation. Bottom row shows a clean data table titled 'Knowledge Gaps & Low-Confidence Queries' displaying recent queries with red/orange confidence score badges (<60%), source page counts, and user emails, next to a horizontal bar chart of 'Top Referenced Notion Documents'. High fidelity, crisp data visualization, professional Streamlit / modern BI design. --ar 16:9 Ver más
More images like this