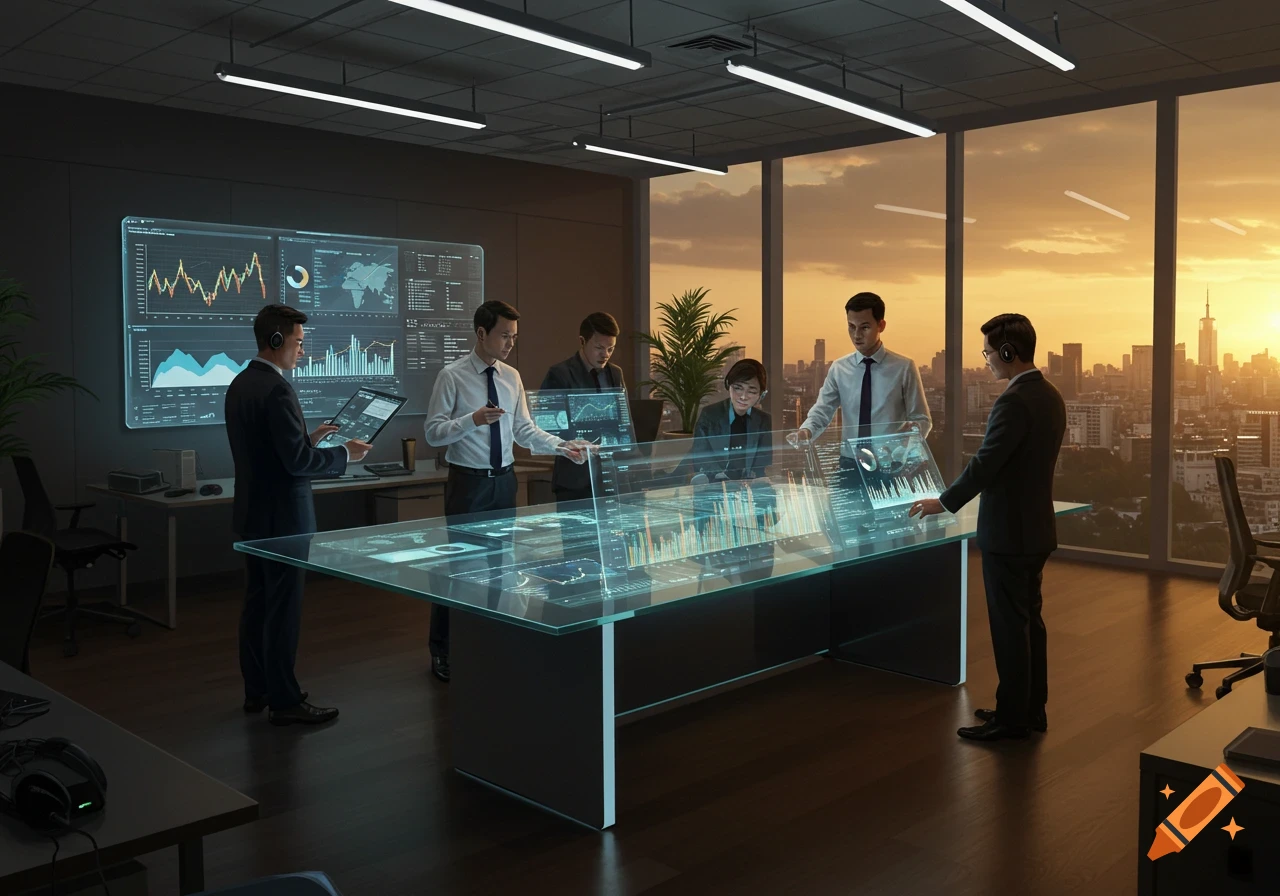
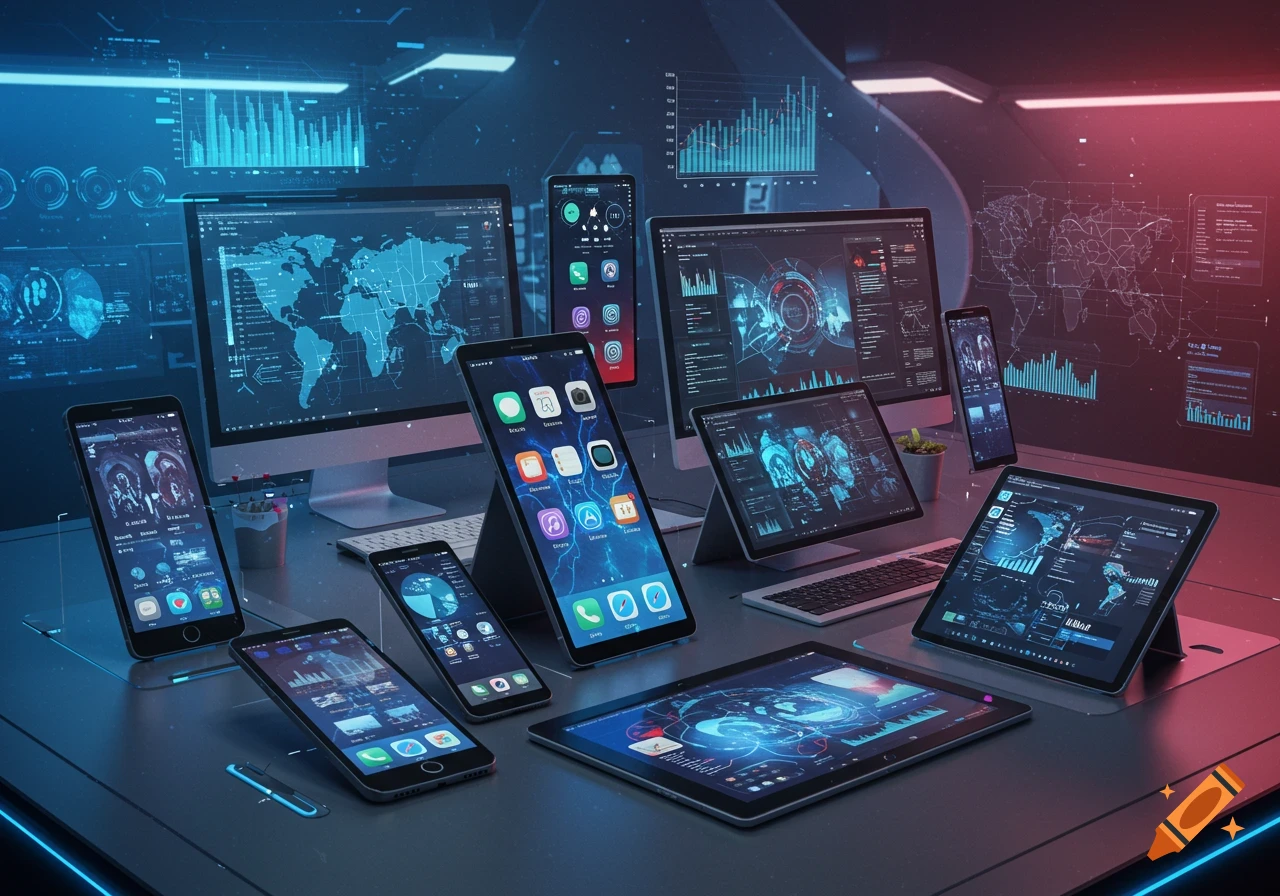
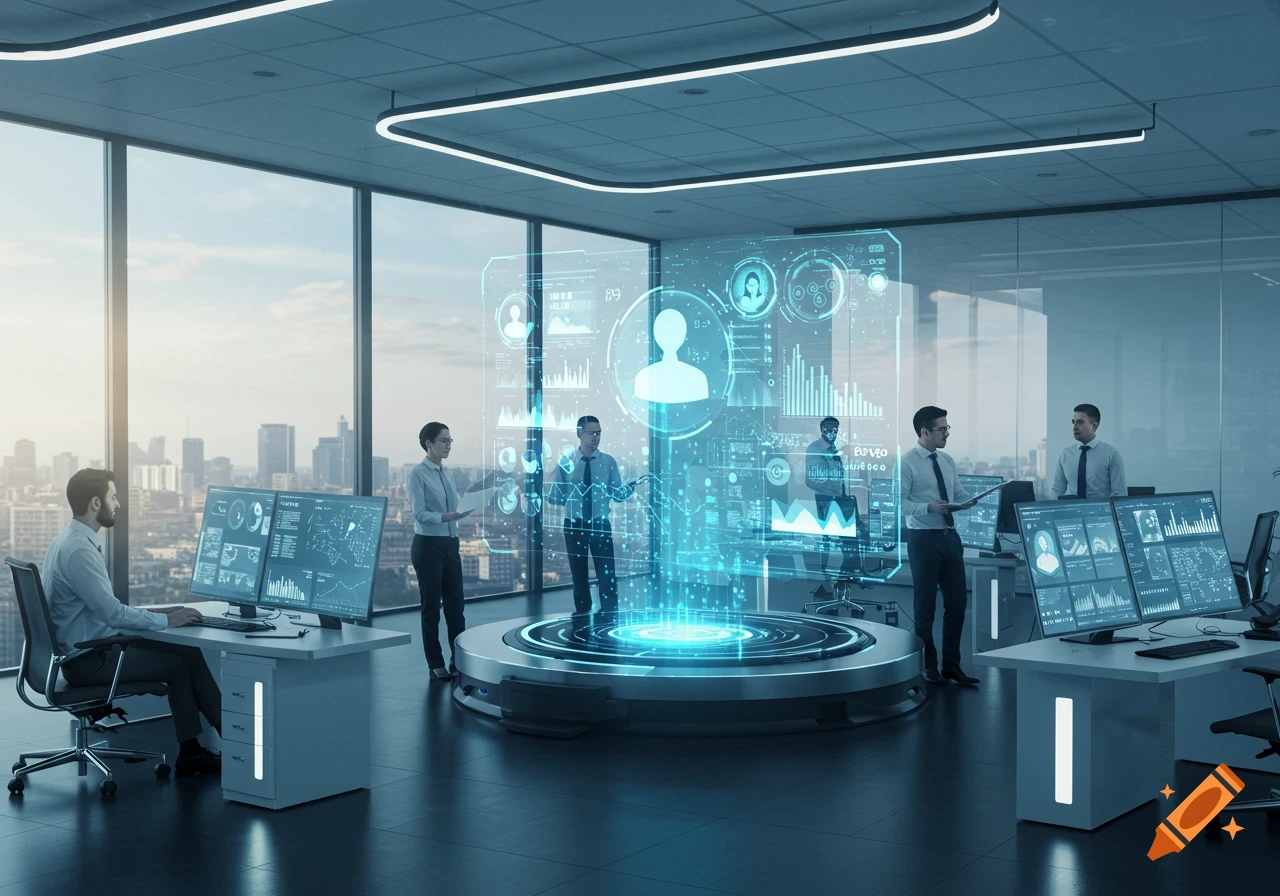
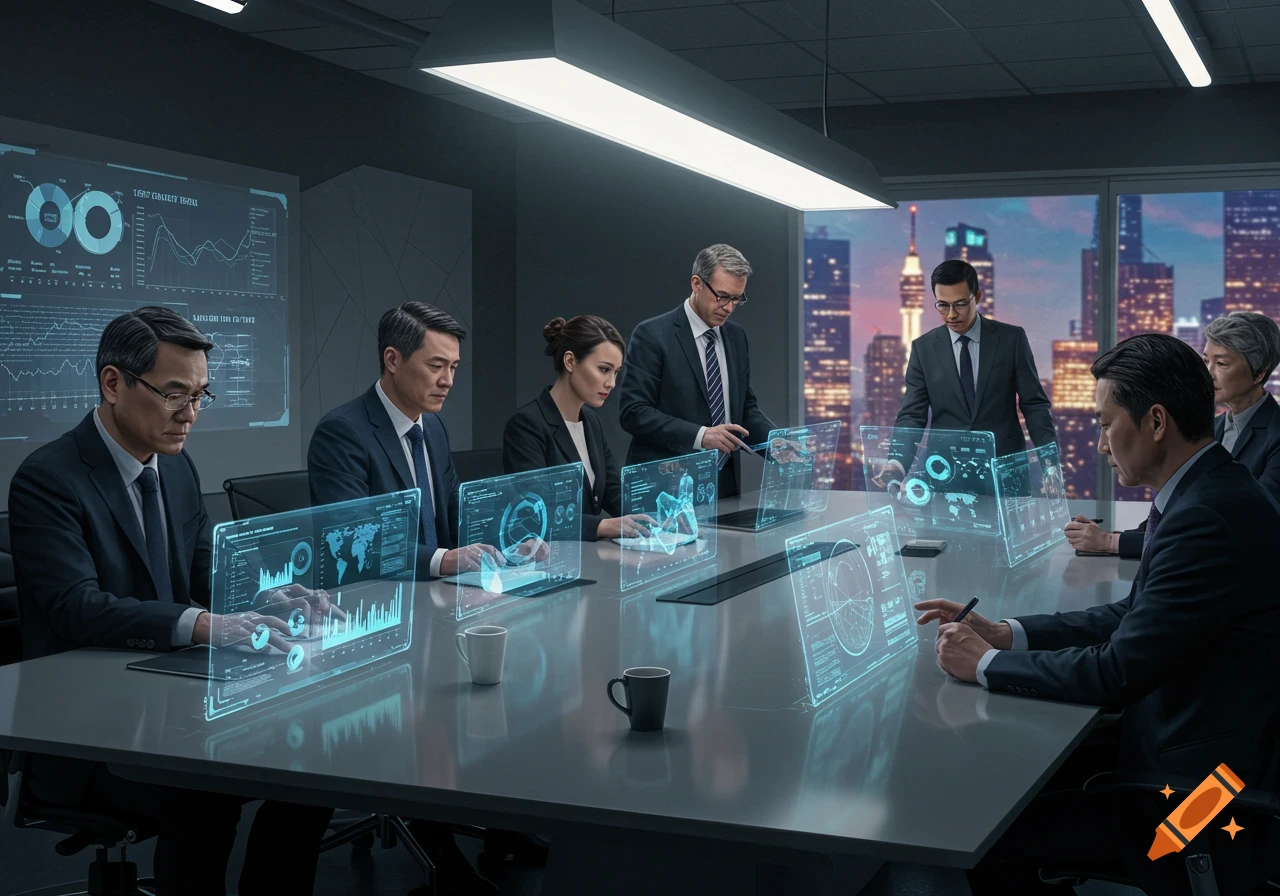
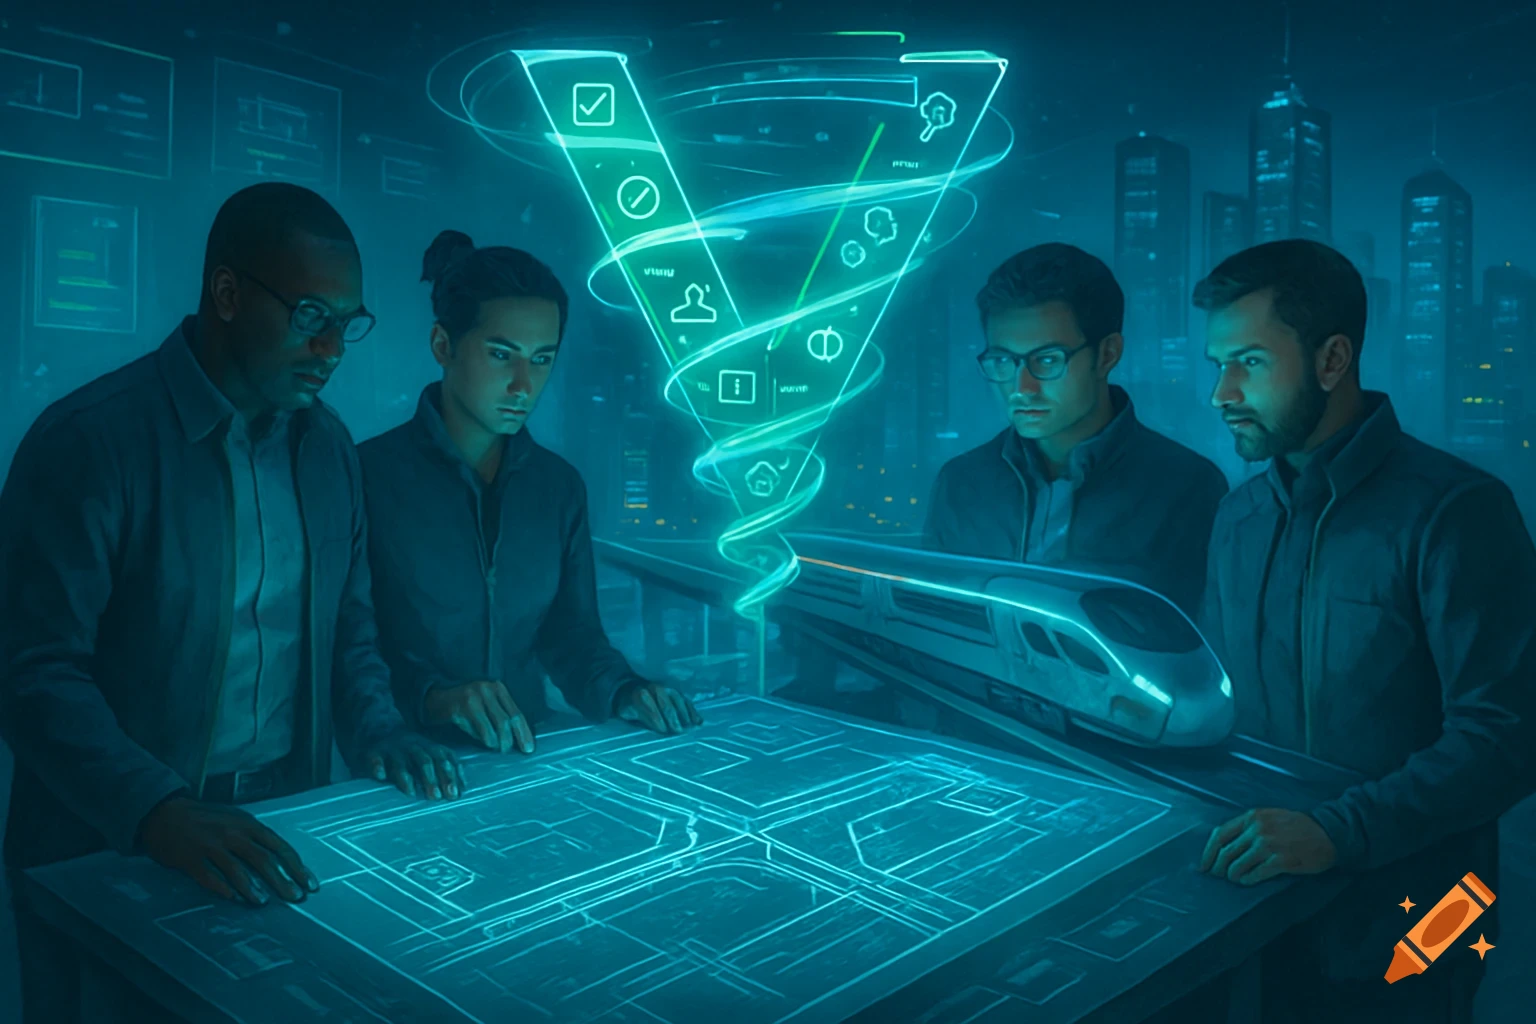
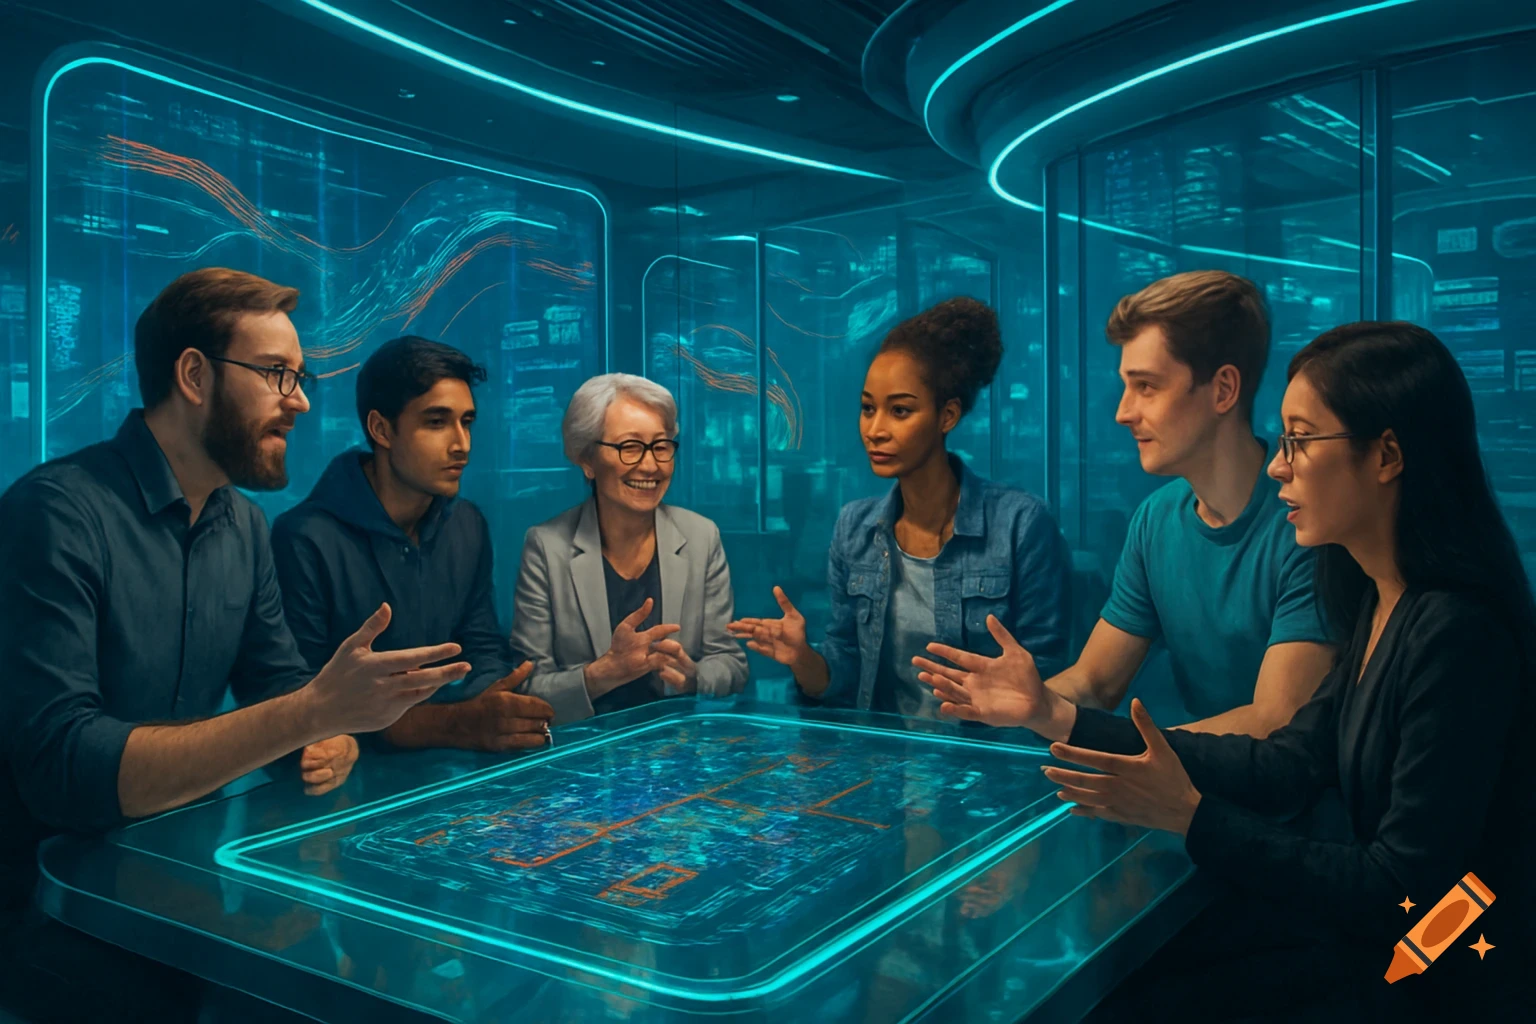
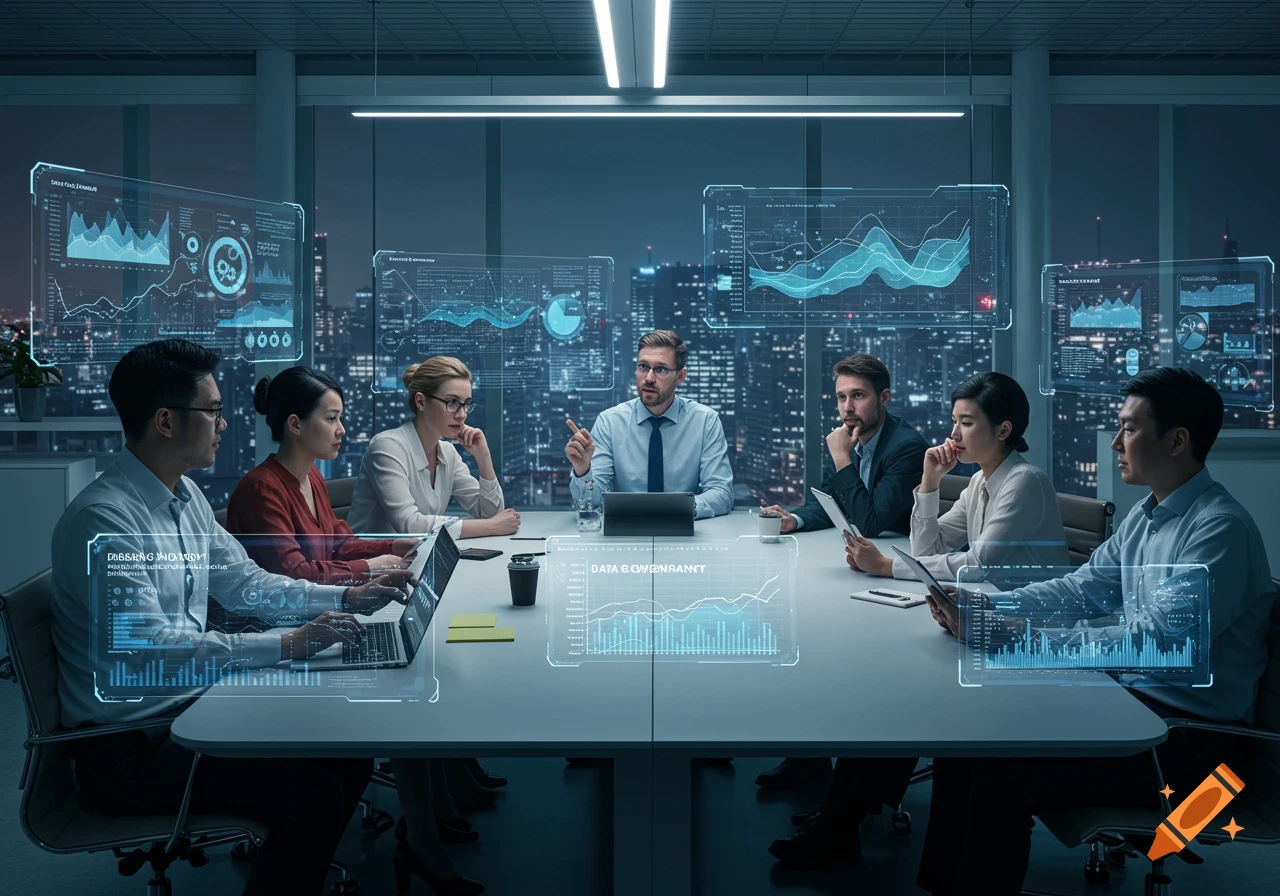
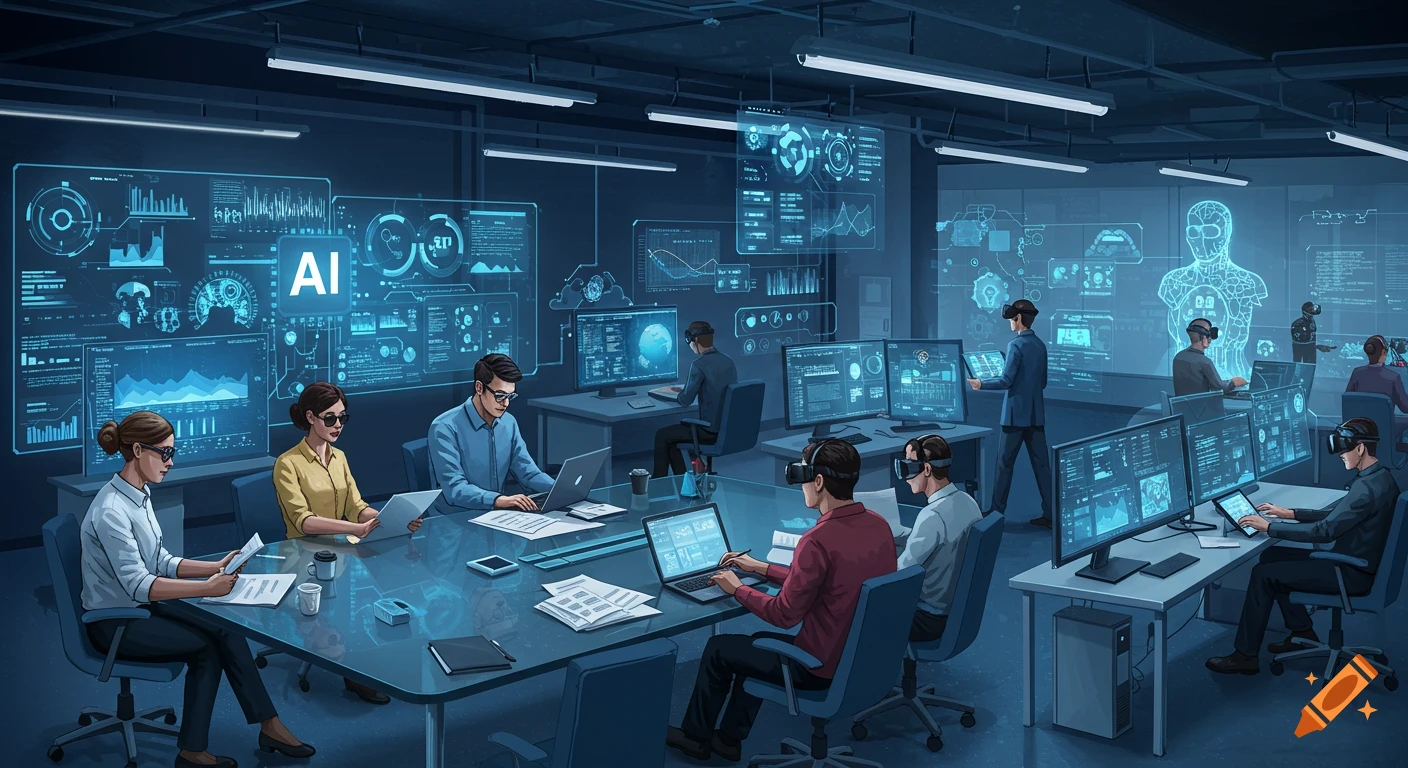
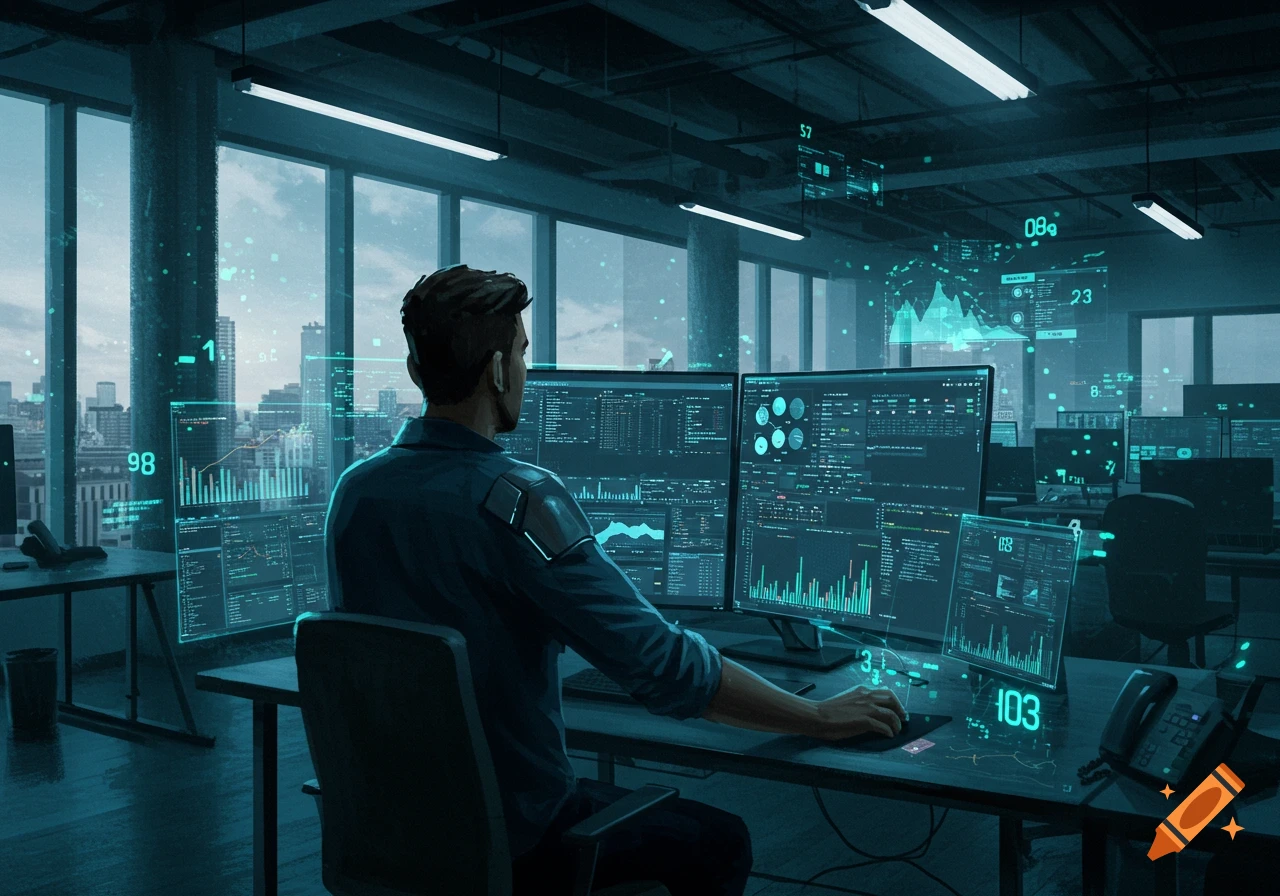
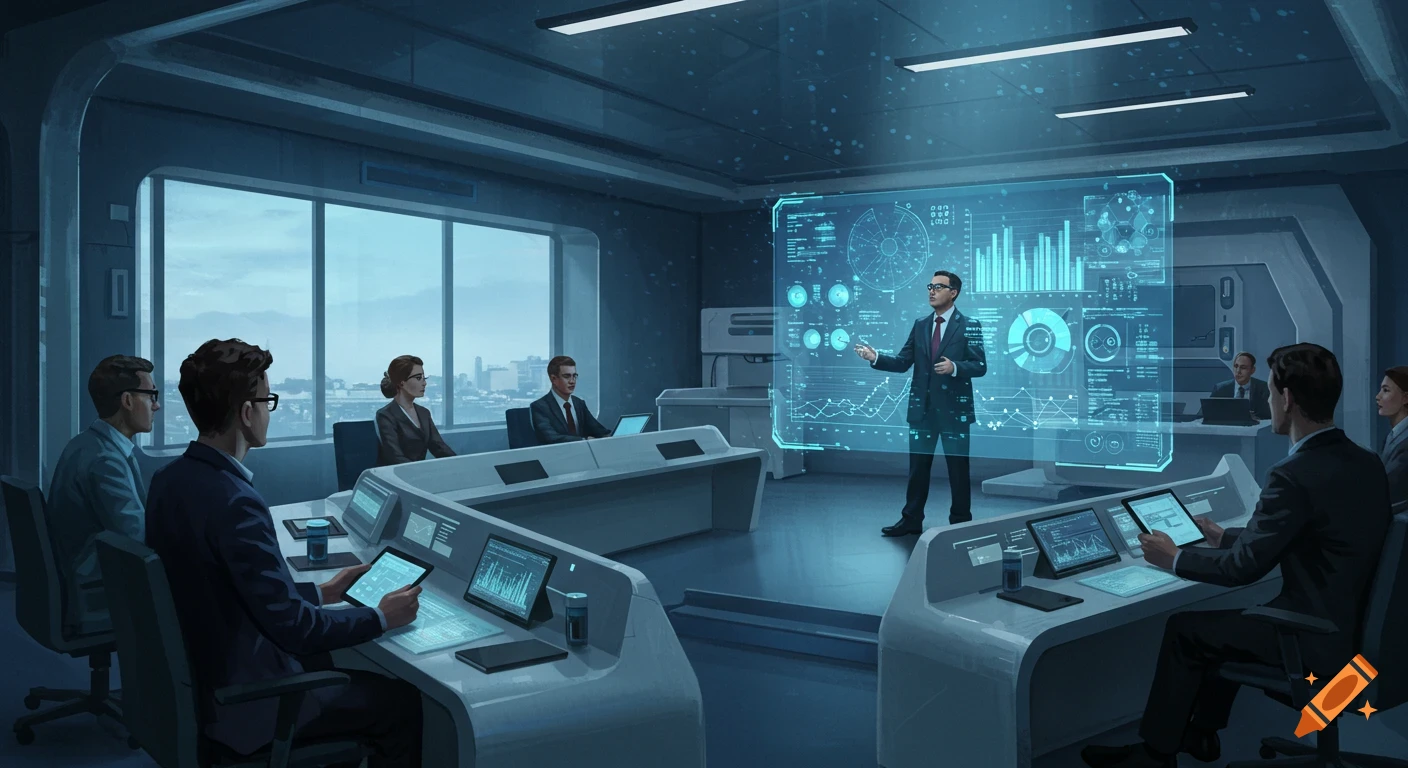
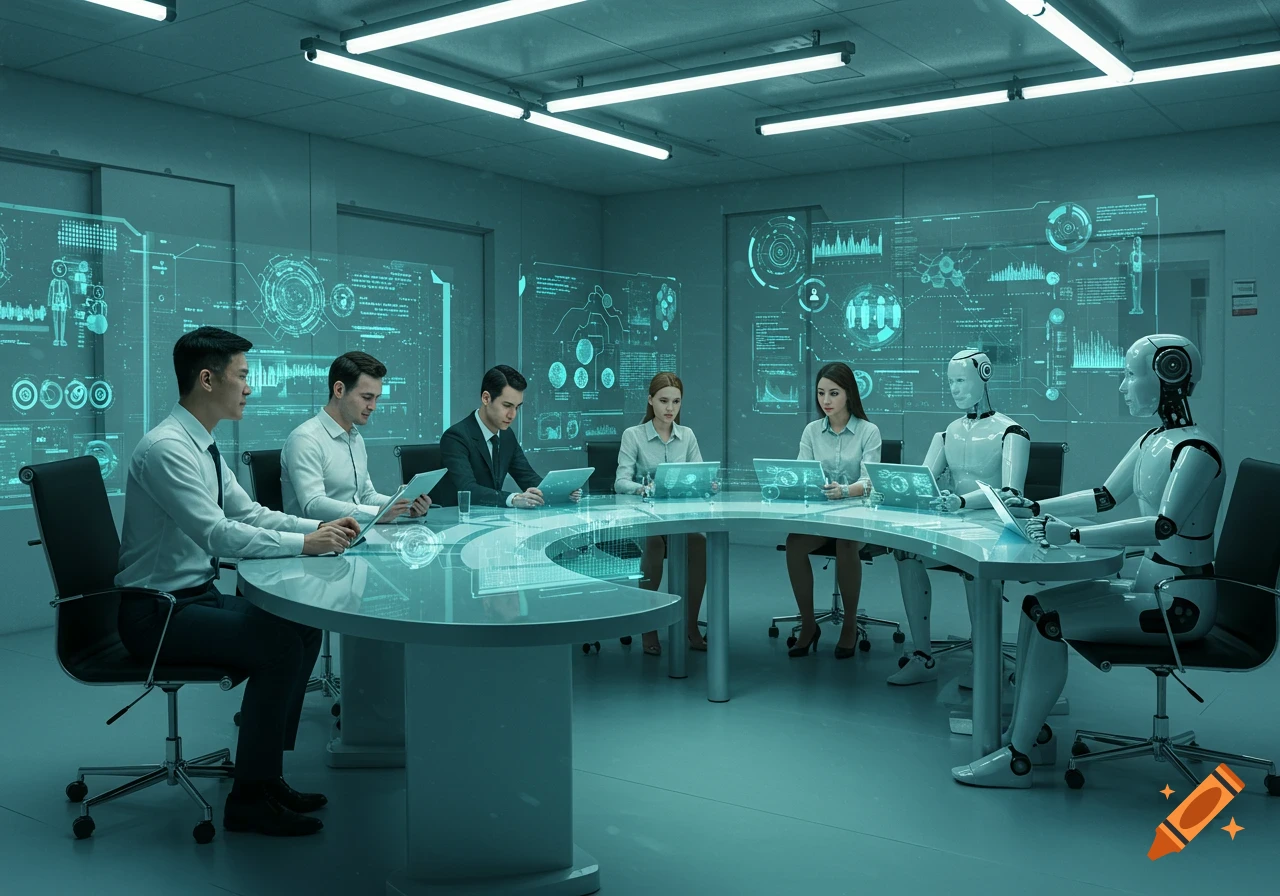
A diverse group of people in a dark, futuristic office with neon blue accents, gathered around tables, interacting with laptops and smartphones while a large screen displays a sleek, data-rich dashboard with various graphs and charts.

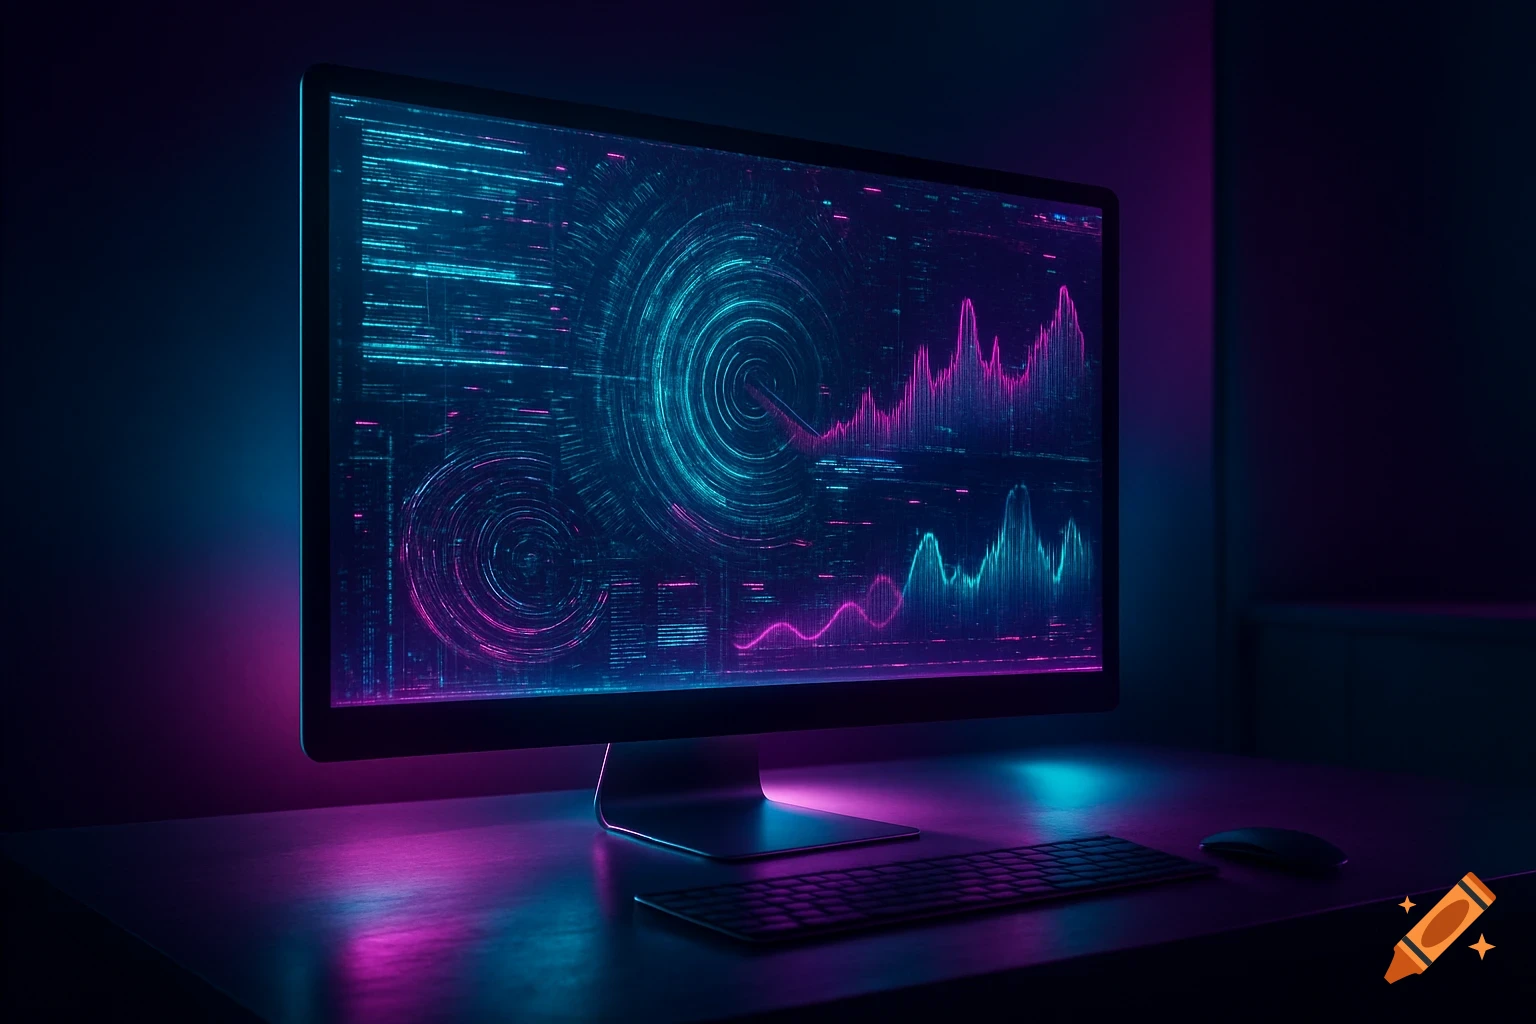
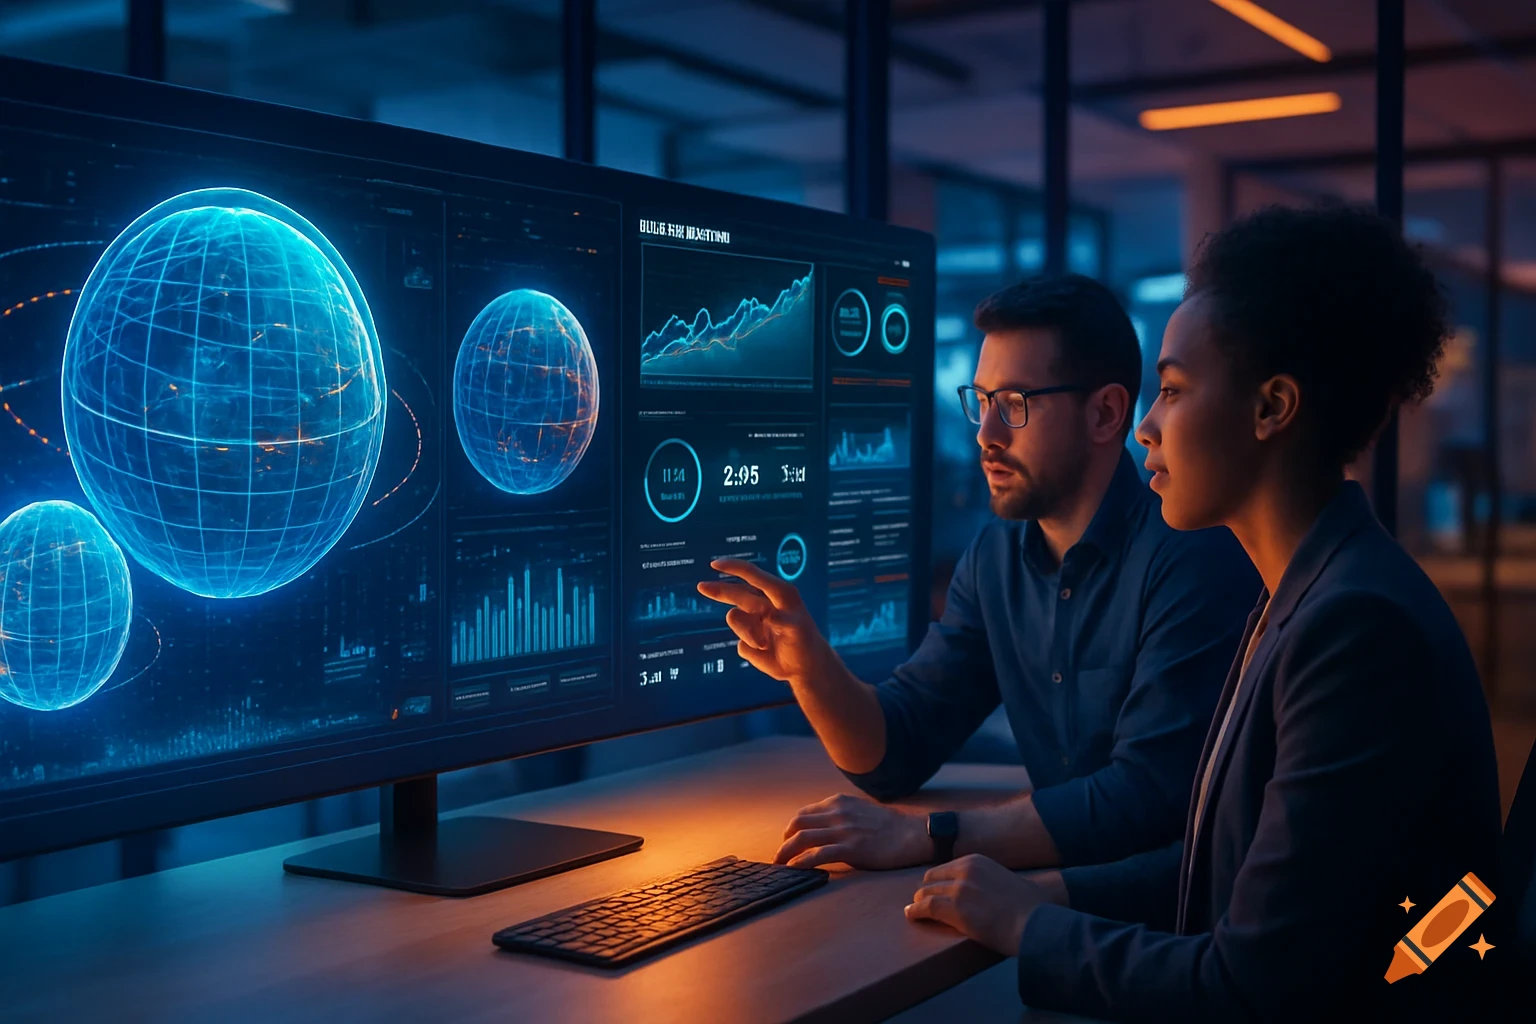
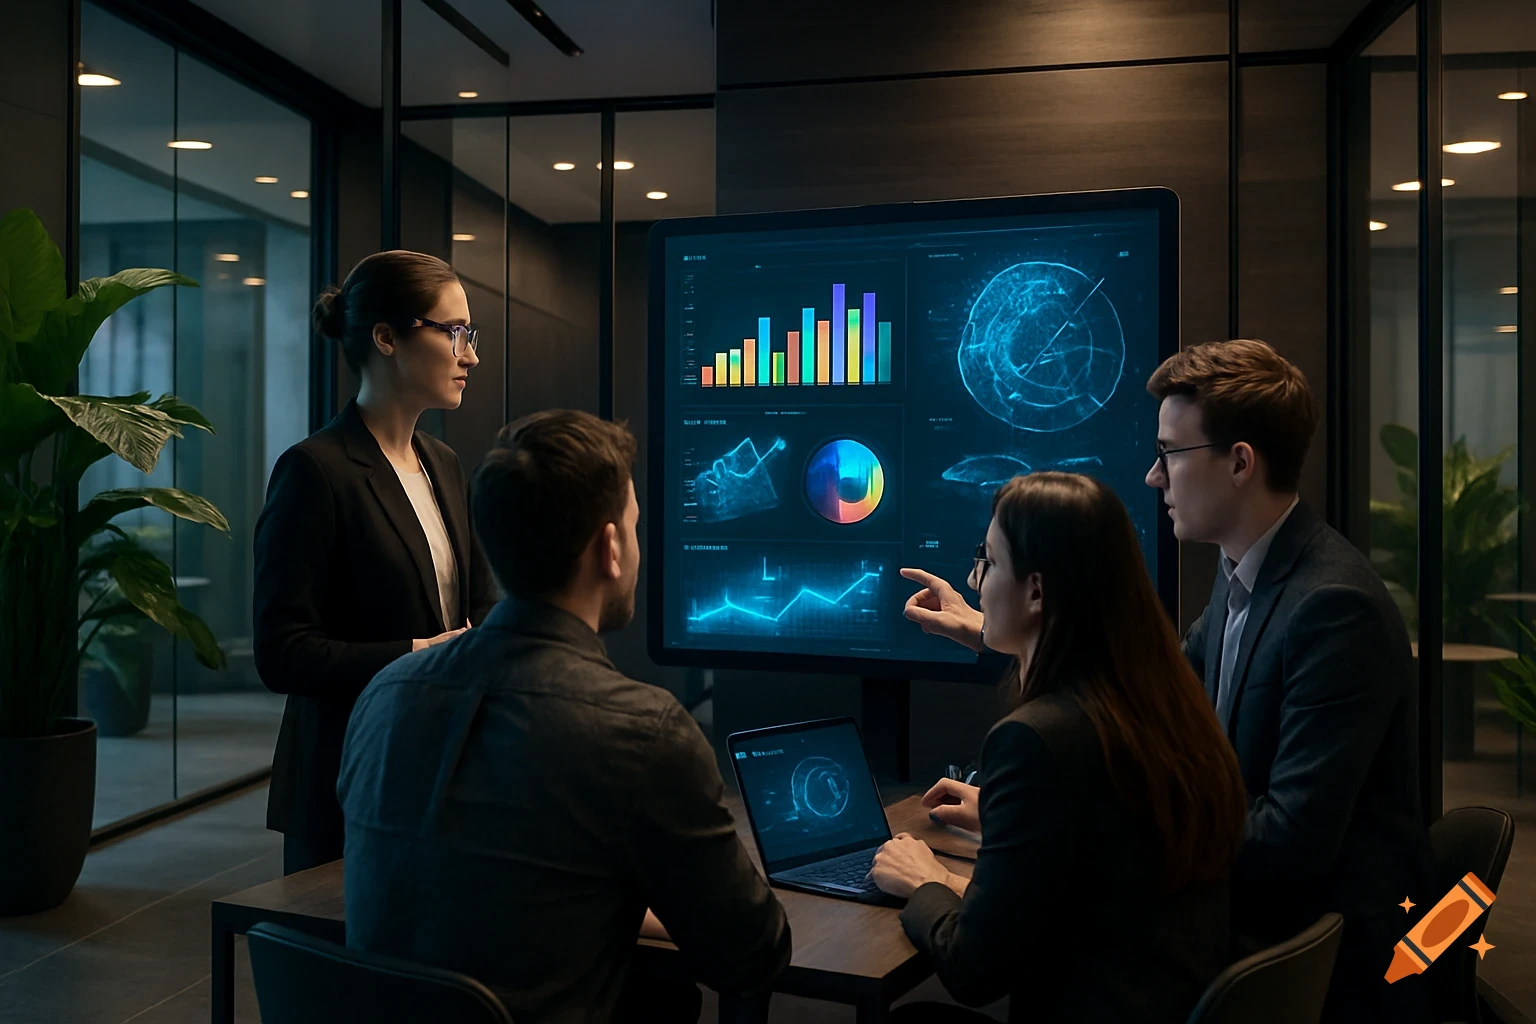
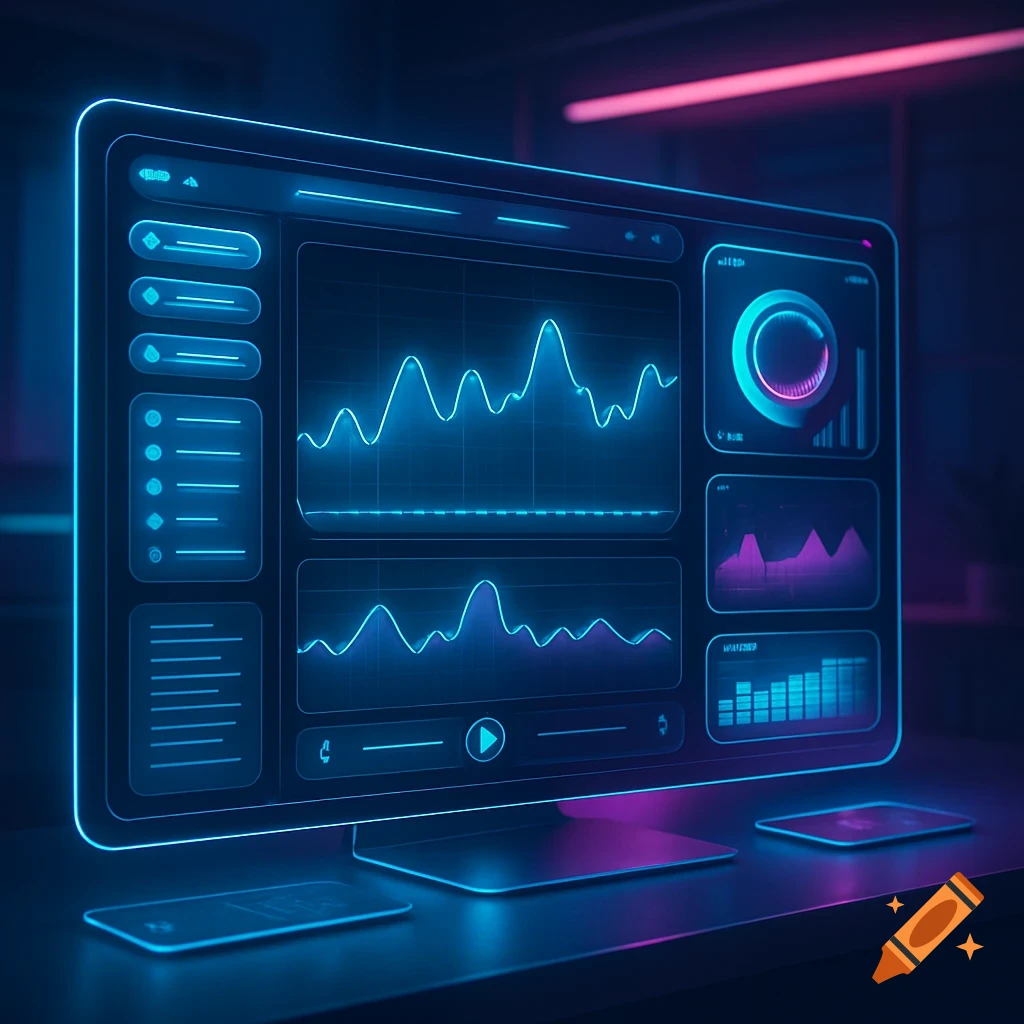
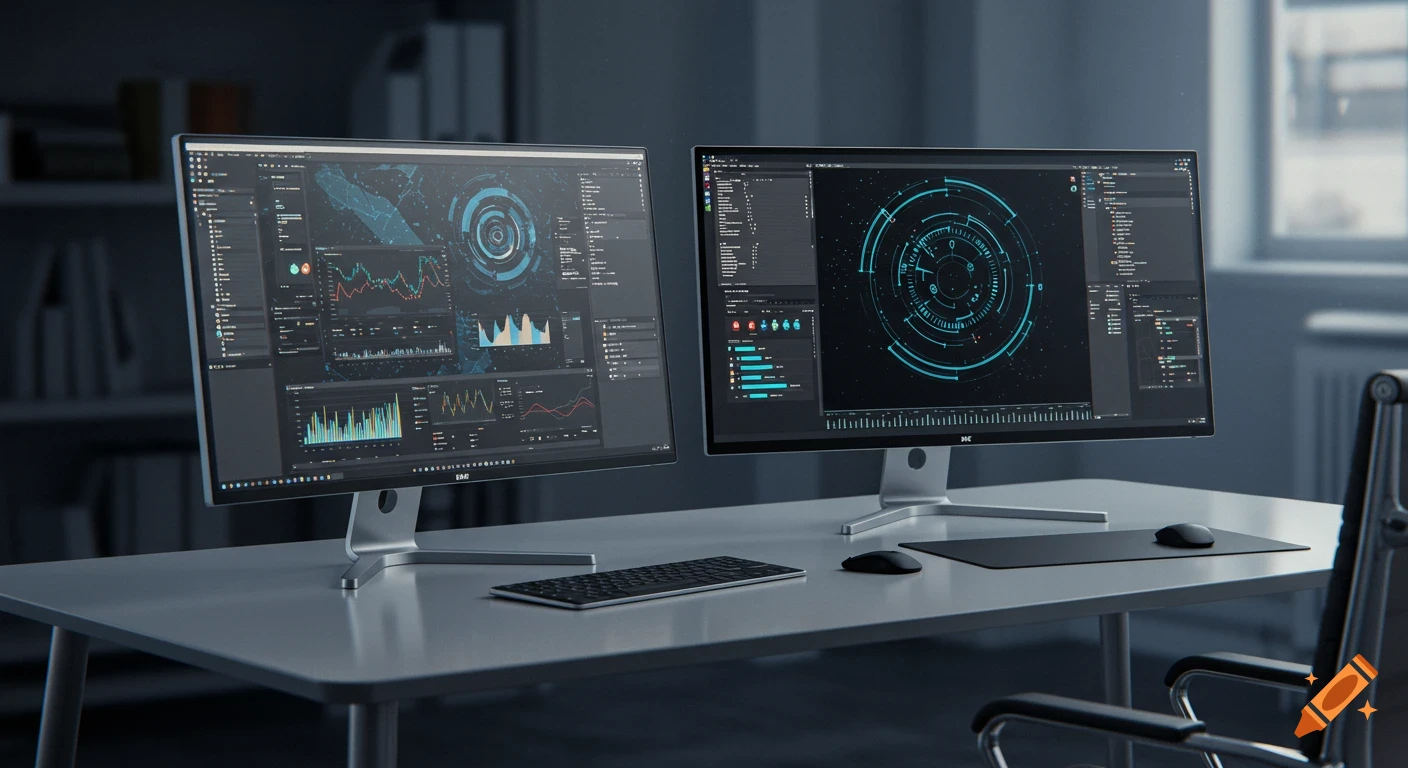
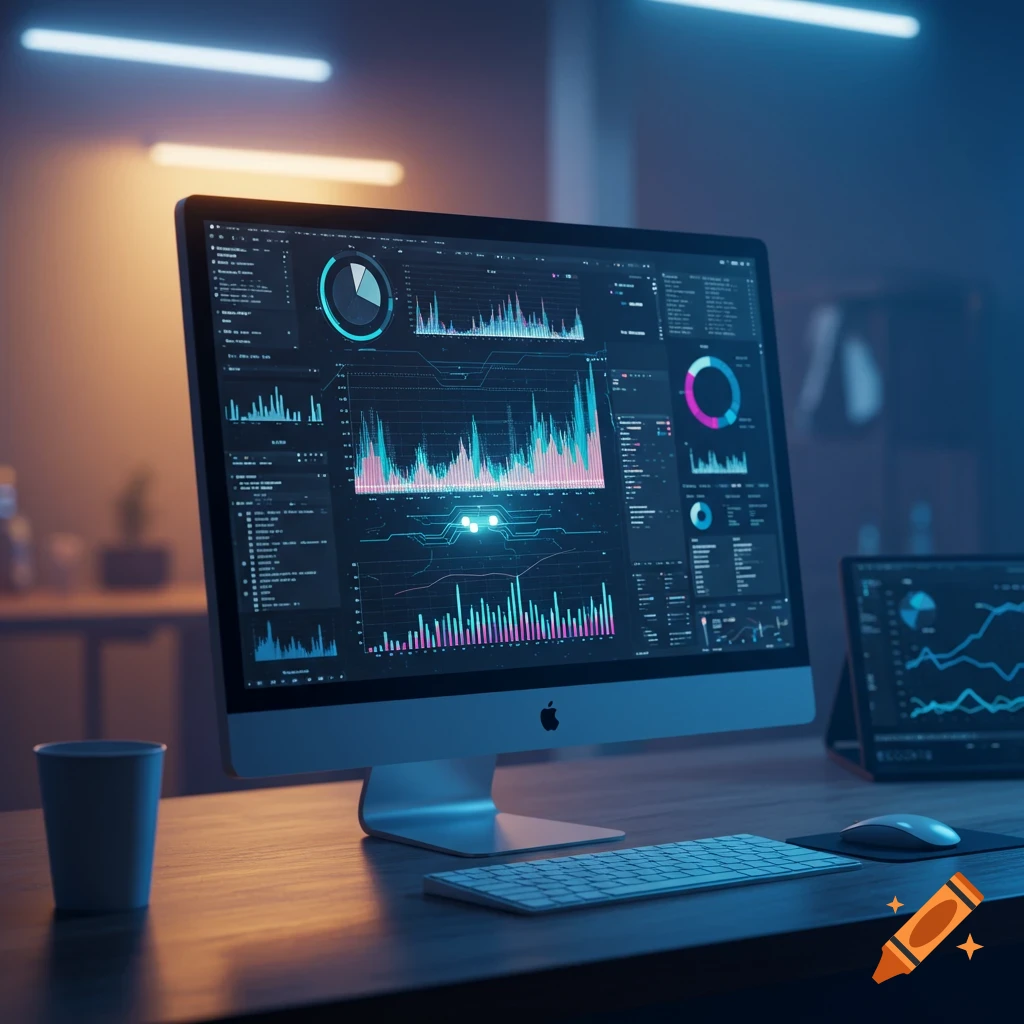
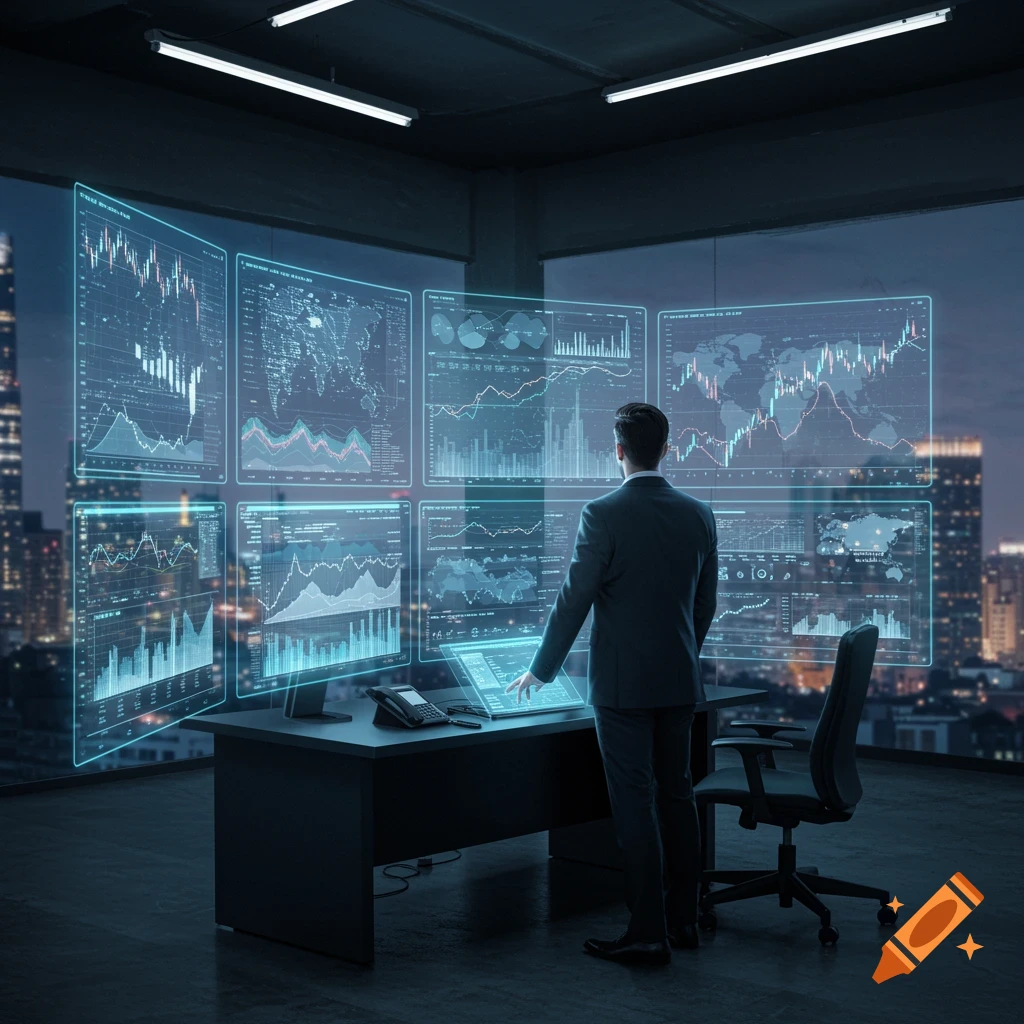
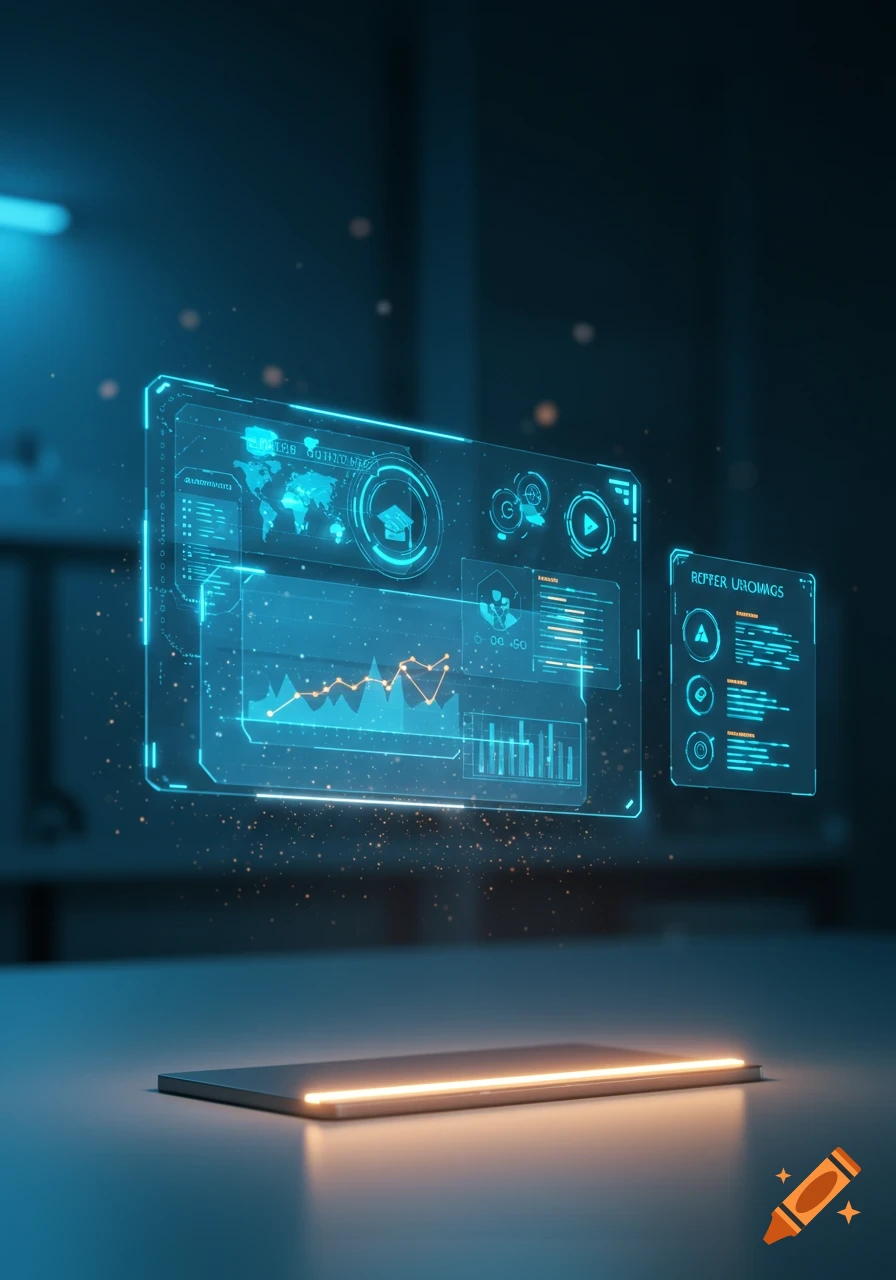
Generate a futuristic, sleek, and vibe-coded web app dashboard inspired by designs like WHOOP. The dashboard should feature: A clean, modern interface with smooth curves, dark theme (black, navy, and gray tones), and neon accents (blue, purple, and teal). Interactive visualizations showing relationships between different variables, such as scatterplots, line graphs, and heatmaps, with clear labels and dynamic tooltips for understanding data connections. Temporal trends displayed as layered time-series graphs, with user-friendly toggles or sliders to explore inter-variable temporal relationships over time. A section highlighting missingness, represented by gaps in data visualizations, faded-out data points, or missing chunks in graphs, with clear annotations showing the extent of missing data. Include user interaction elements like dropdowns, filters, and clickable widgets to simulate an active user study. The scene should also depict a conceptual user study environment: A group of diverse users interacting with the dashboard on various devices (laptops, tablets, smartphones). Users actively analyzing variables, comparing temporal relationships, and discussing missingness in the data. The background should suggest a modern lab or office environment with a tech-savvy and professional atmosphere. Ver más
More images like this