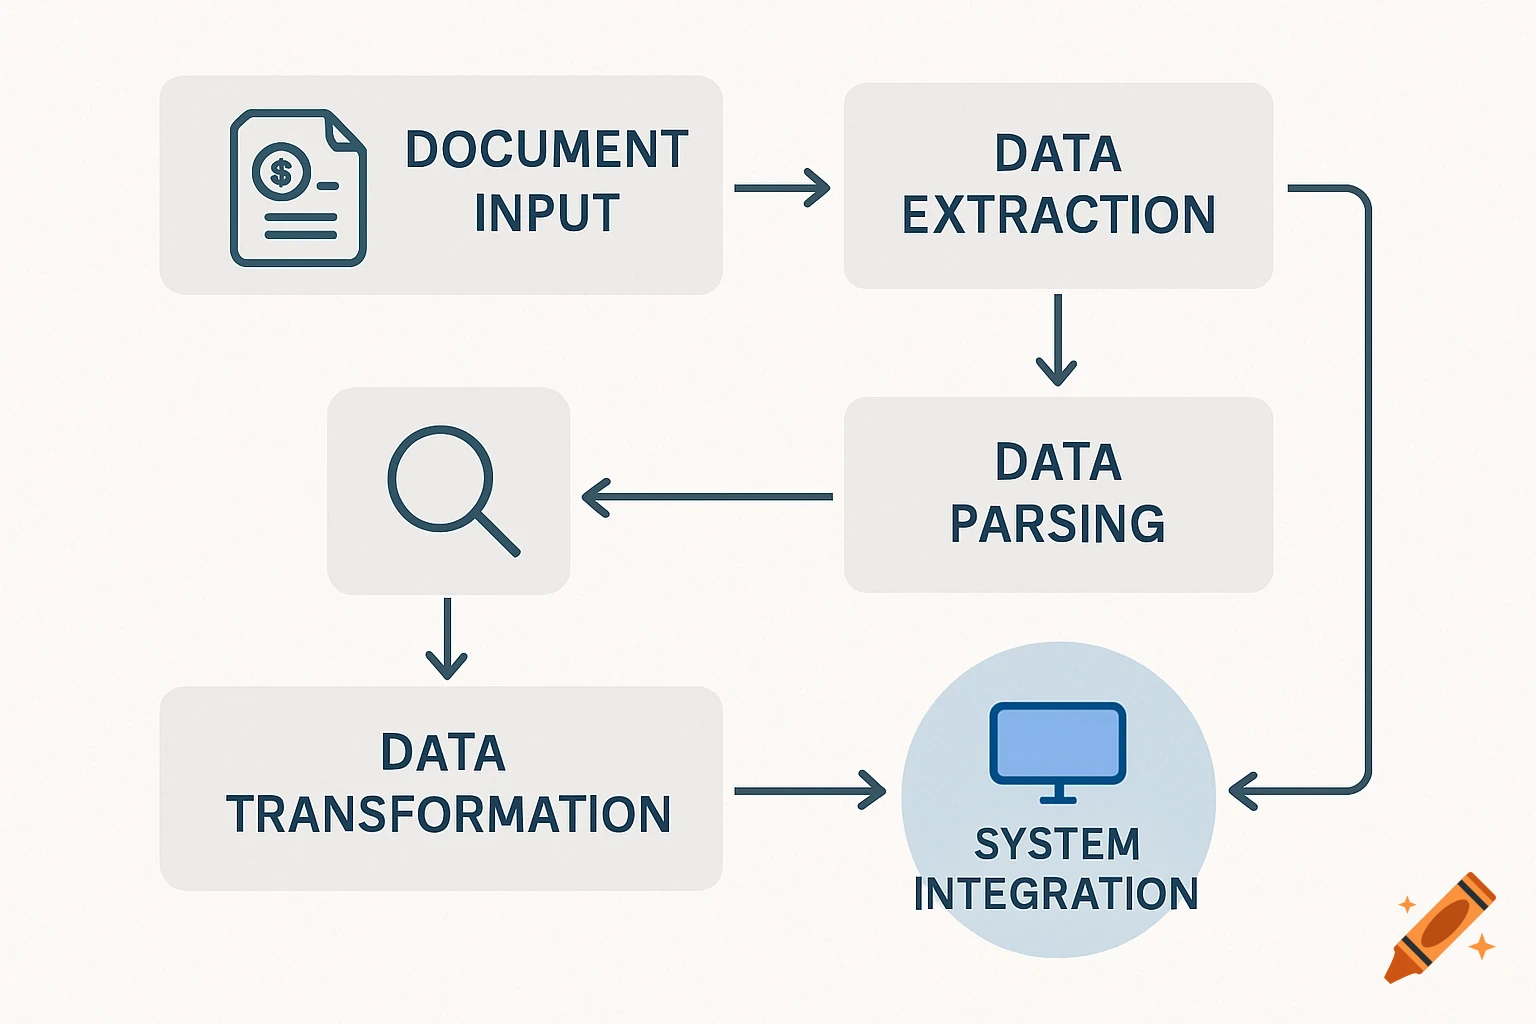
Technical diagram showing data processing flow from raw input to algorithmic processing to analytics dashboard on a grid background.

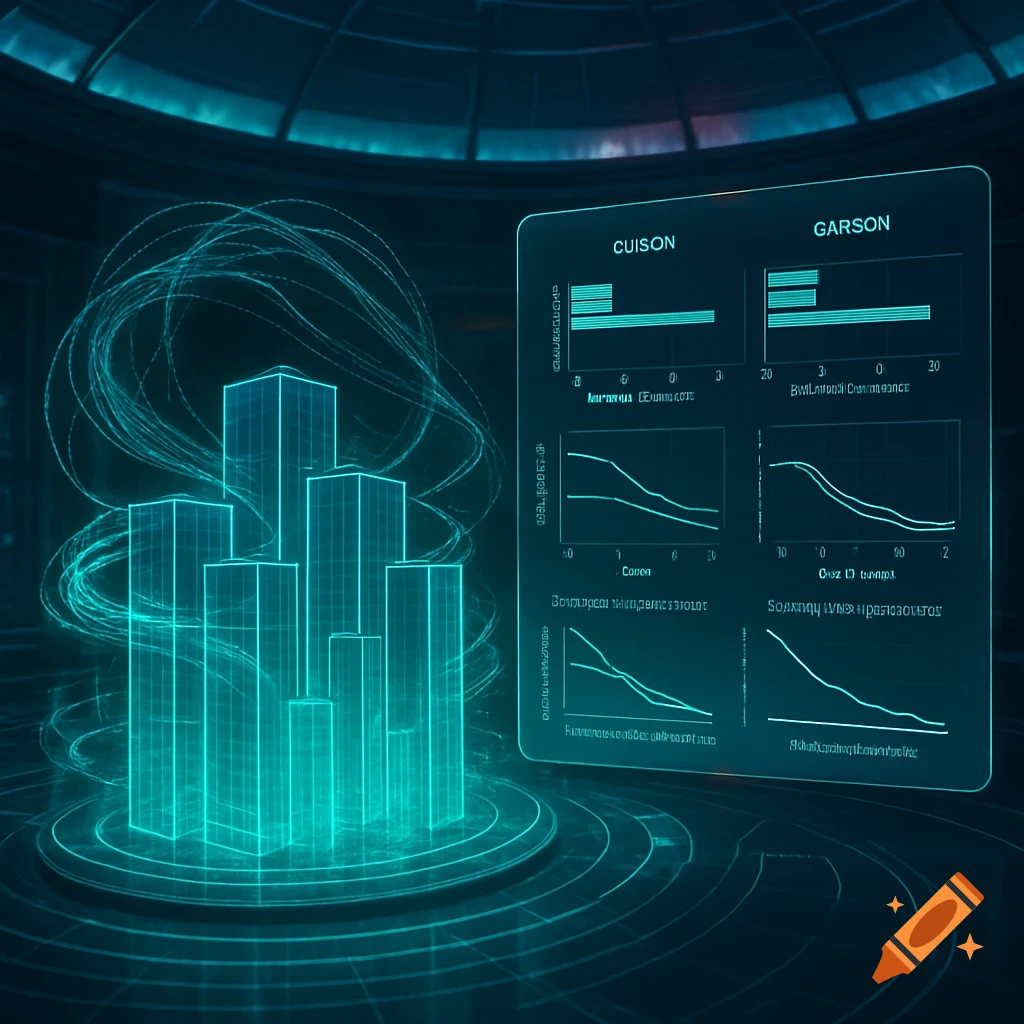
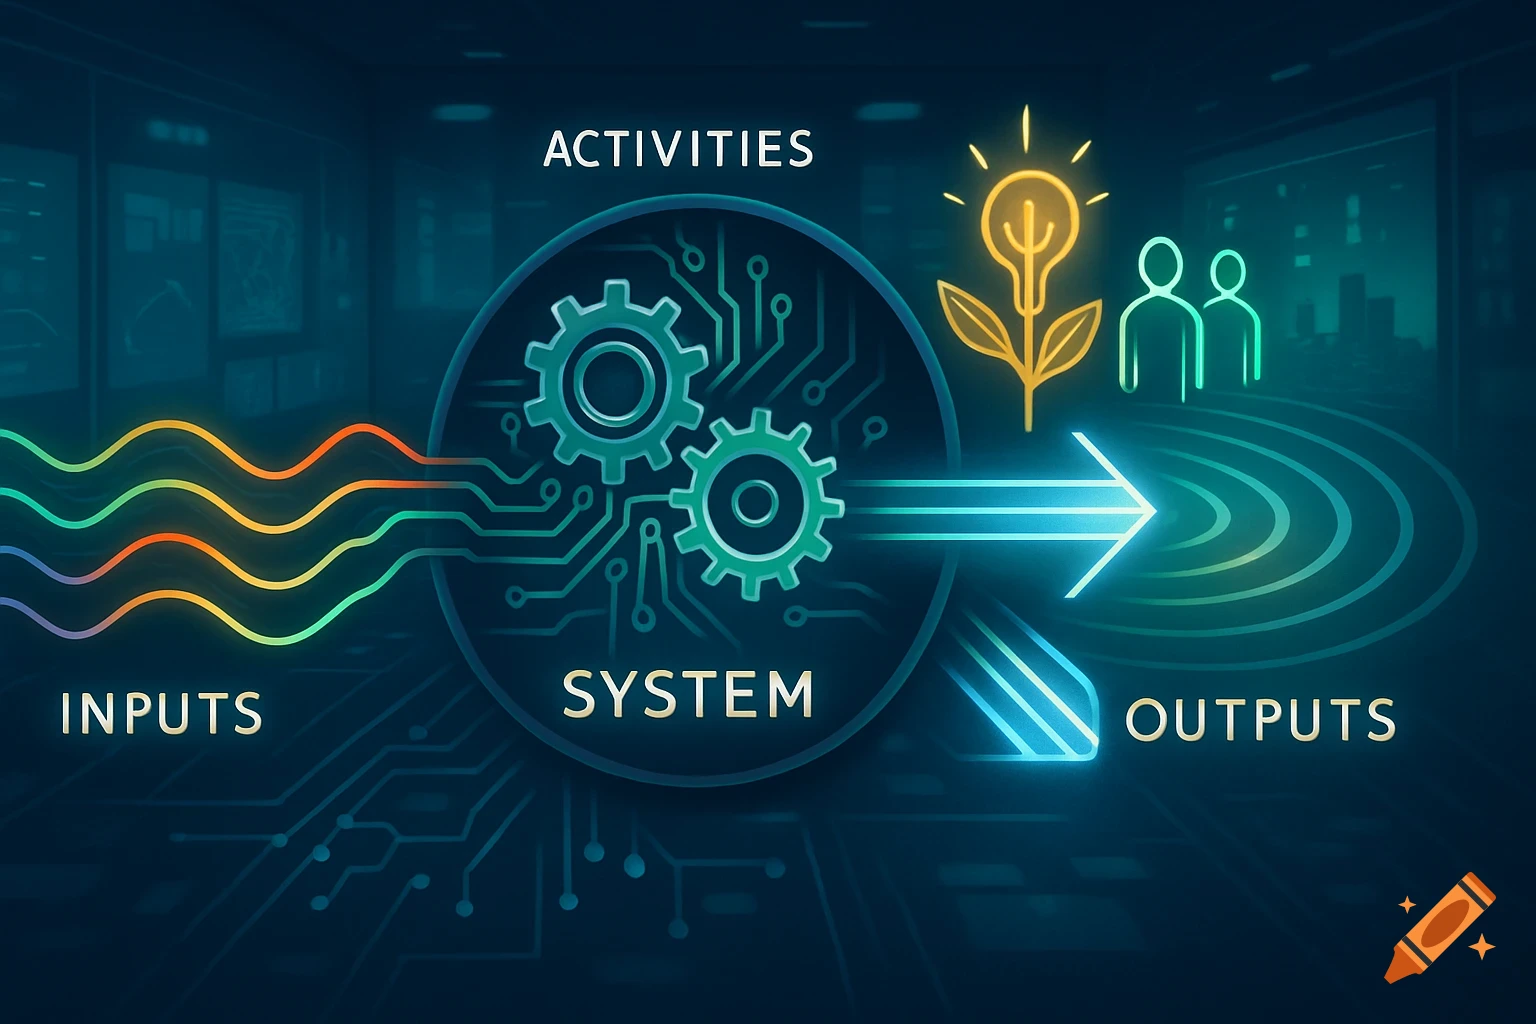
A clean technical schematic with three connected rectangular boxes on a light blue grid background. The left box (labeled "RAW INPUT") contains scattered unlabeled data points of varying shapes and colors. The middle box (labeled "ALGORITHMIC_PROCESSING" in glowing letters) shows the data being transformed by swirling algorithmic patterns. The right box (labeled "ANALYTICS DASHBOARD") displays organized data clusters with clean visualizations - bar charts, heat maps and grouping diagrams. Thin See more
More images like this