Flat infographic diagram of an industrial factory process with labels for machines, energy usage, and an efficiency dashboard.
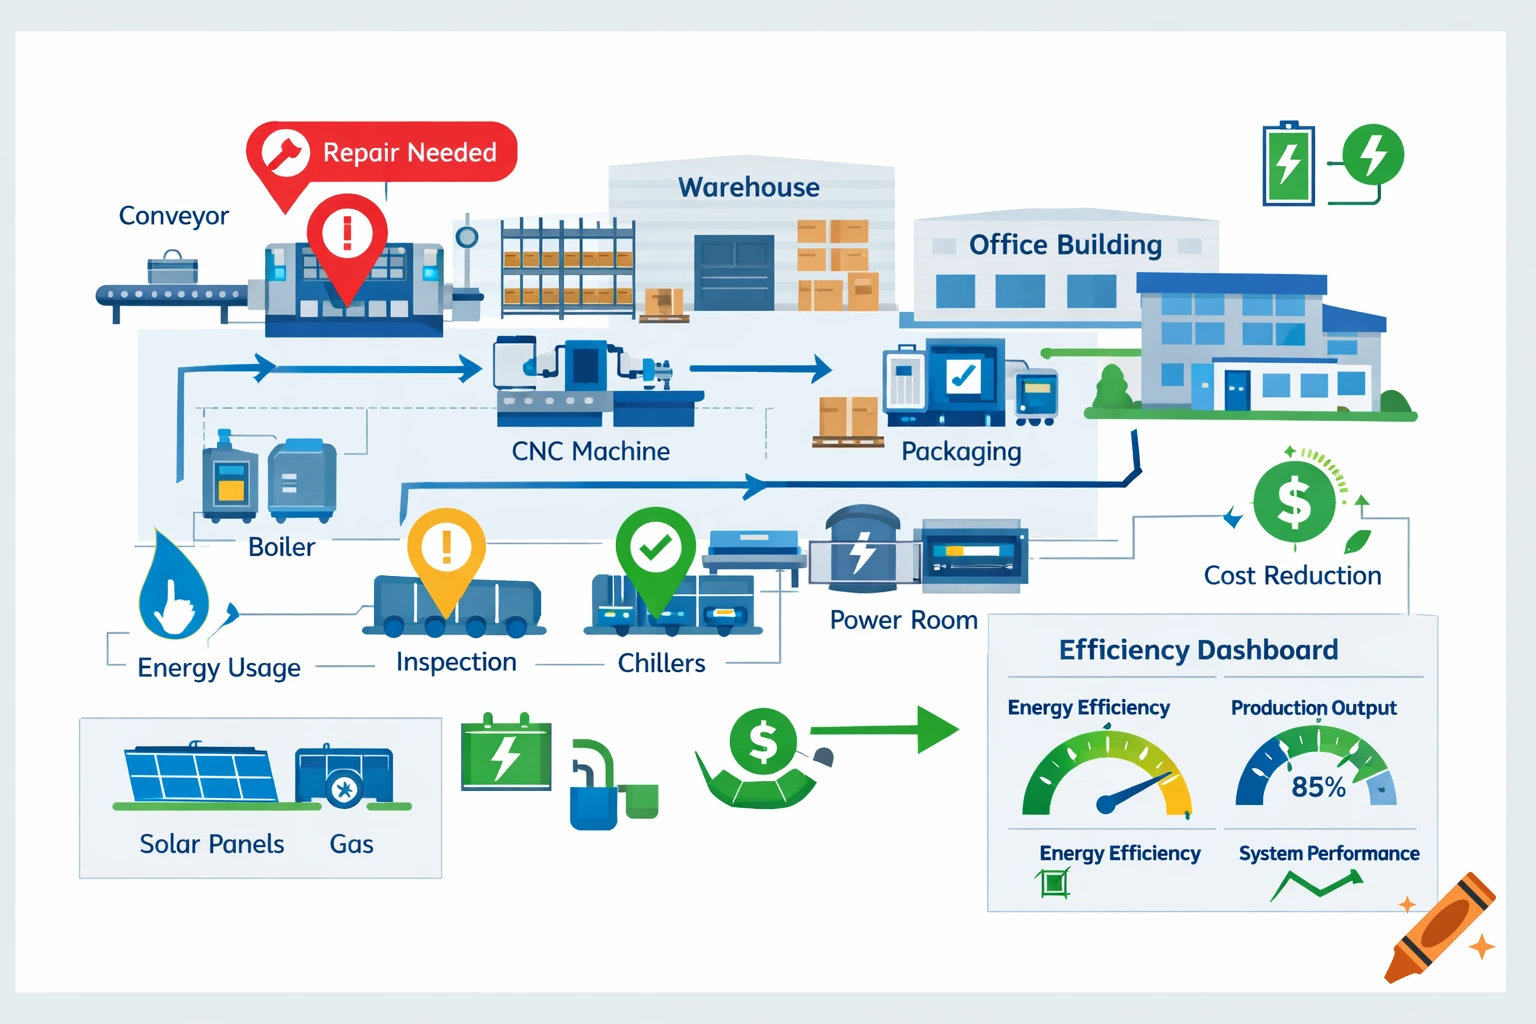
Explanatory flat infographic diagram for a PowerPoint presentation. Central simplified map or building layout (industrial plant, factory, warehouse, or campus). Detailed equipment mapping represented by icons and labels on machines and installations. Geolocated maintenance tracking with GPS markers and maintenance symbols. Spatial analysis of internal flows represented by arrows and flow lines inside the site. Energy and operational optimization illustrated by efficiency indicators, energy icons, and performance dashboards. Clean, minimal, corporate flat design. White or light background, blue and green color palette, simple icons, short labels. Structured layout, highly readable, optimized for a single PowerPoint slide (16:9). Mehr sehen
More images like this