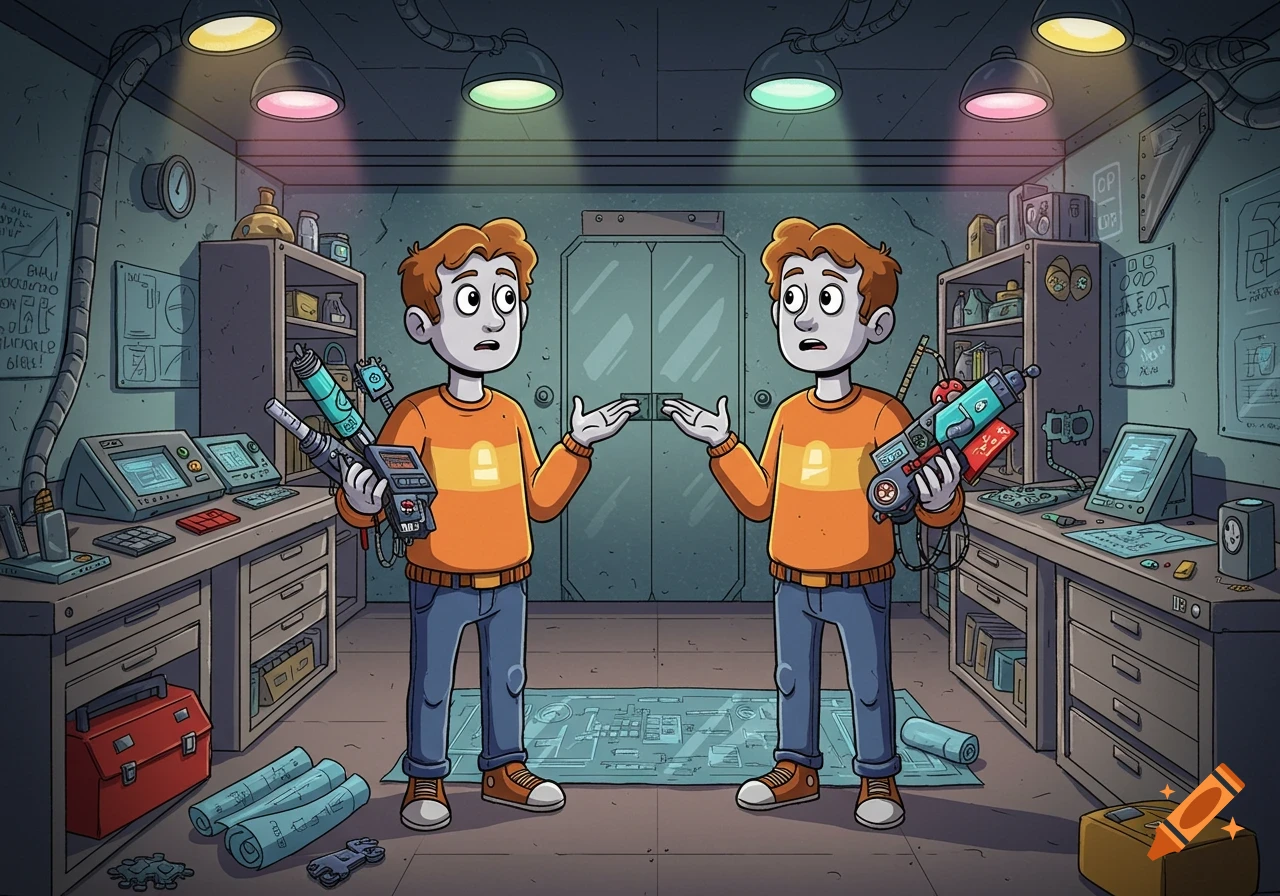
Cartoon illustration of two men making difficult decisions, presented as a complex flowchart with options, complaints, and shared misery, including a mock Excel sheet.
Prompt for illustration (math/statistics version, polished): Two men in a cartoon style with a white background. One man is asking the other to decide between two daily options — red or yellow. The asker is a bit demanding, exaggerated for humor. Flow structure: Option 1 → B → X Option 2 → C → X X → D Where: B and C: minor daily choices (chair color, snack, small household decision) X: humorous complaining (funny, exaggerated pouting or sighing faces) D: shared unhappiness (slightly dramatic but still humorous) Visual cues for the math/statistics vibe: About one-third of the image shows a mock Excel sheet or scatterplot matrix with tiny numbers, checkboxes, and other factors to make it look like a real, “boring” Excel Arrows from options flow out of the Excel section into the cartoon characters Clear arrows and boxes for the flowchart part Whimsical, lighthearted, cartoon style Emphasize “stats nerd humor”, with X as a shared box leading to D No plus signs or actual arithmetic equations Mehr sehen
More images like this