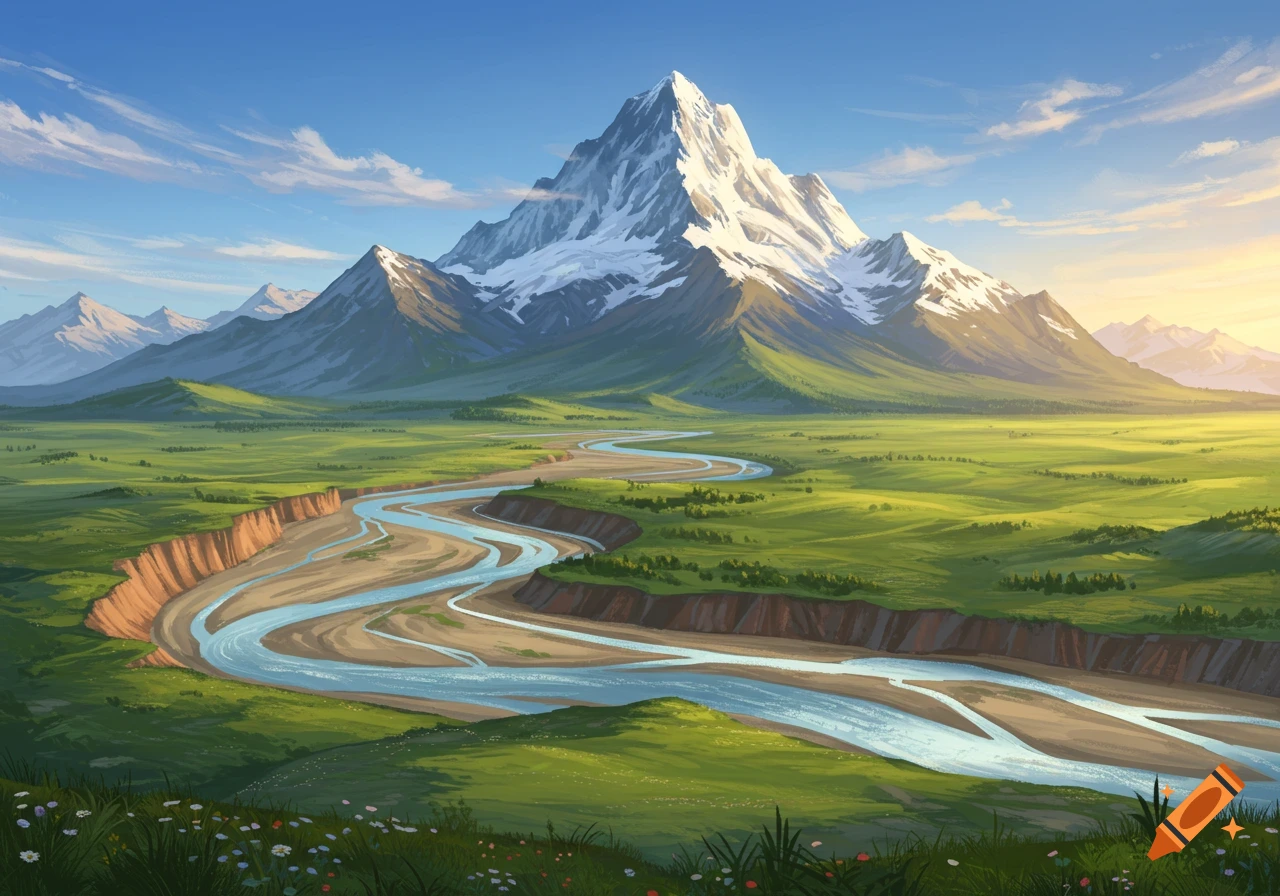
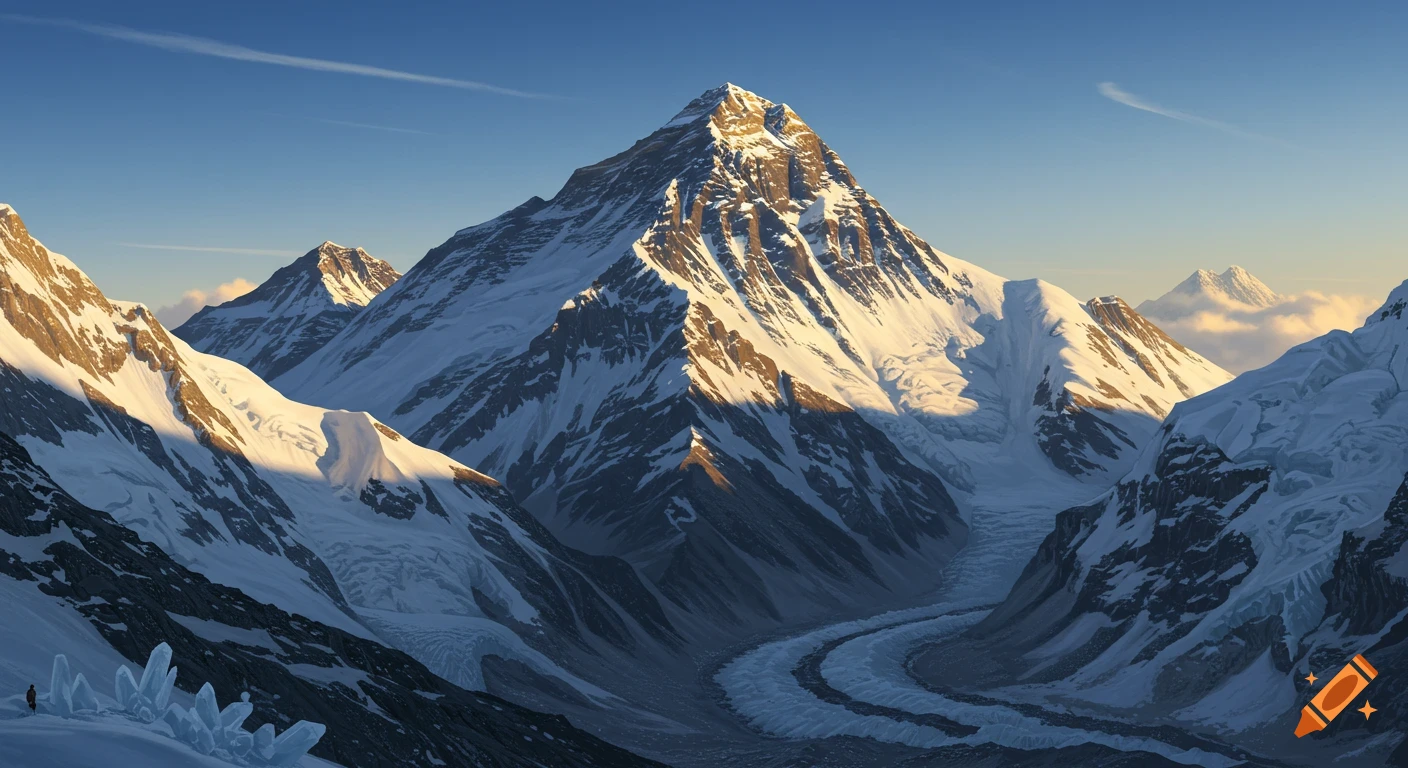
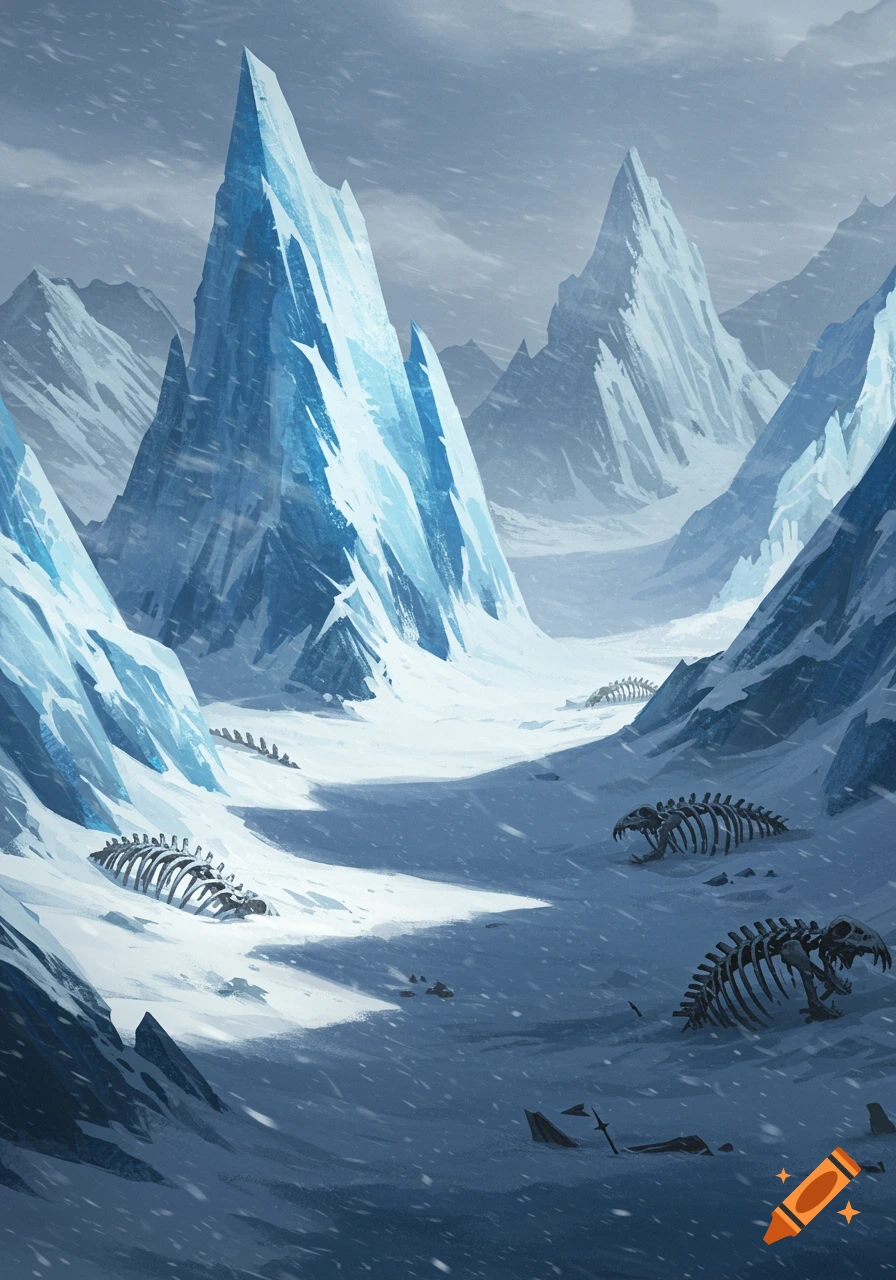
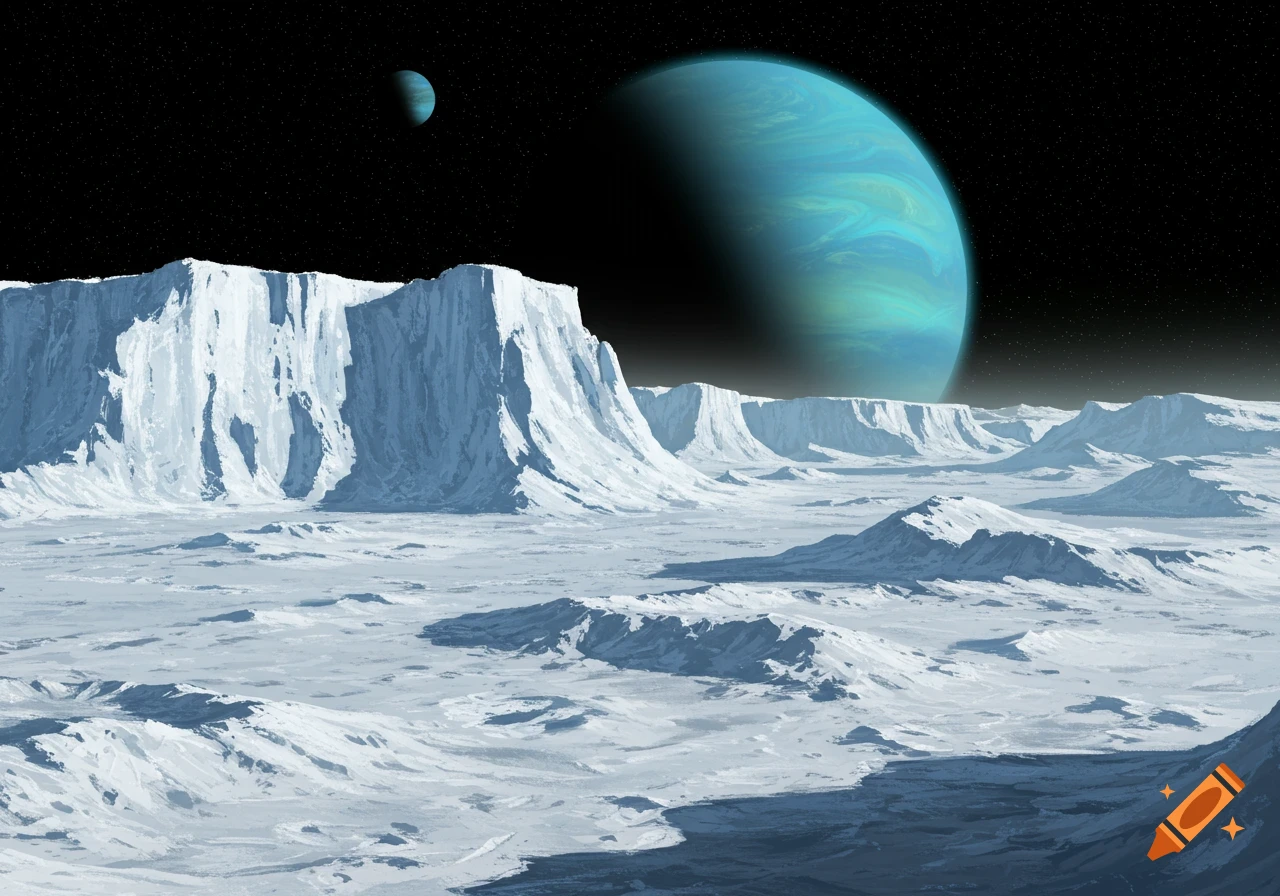
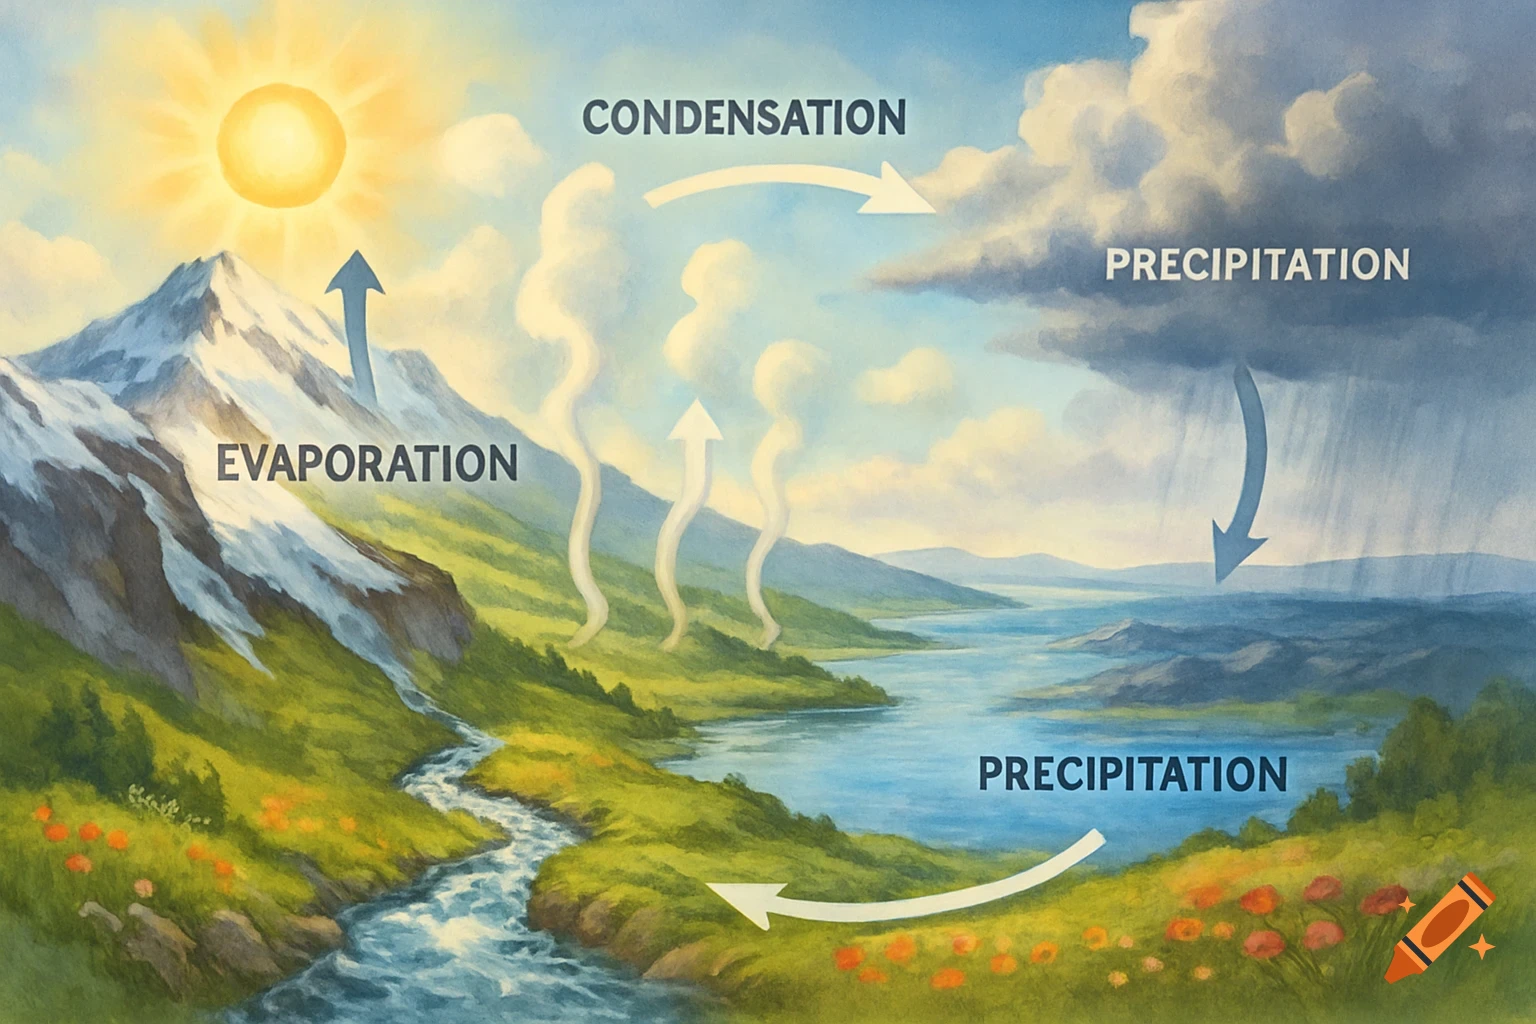
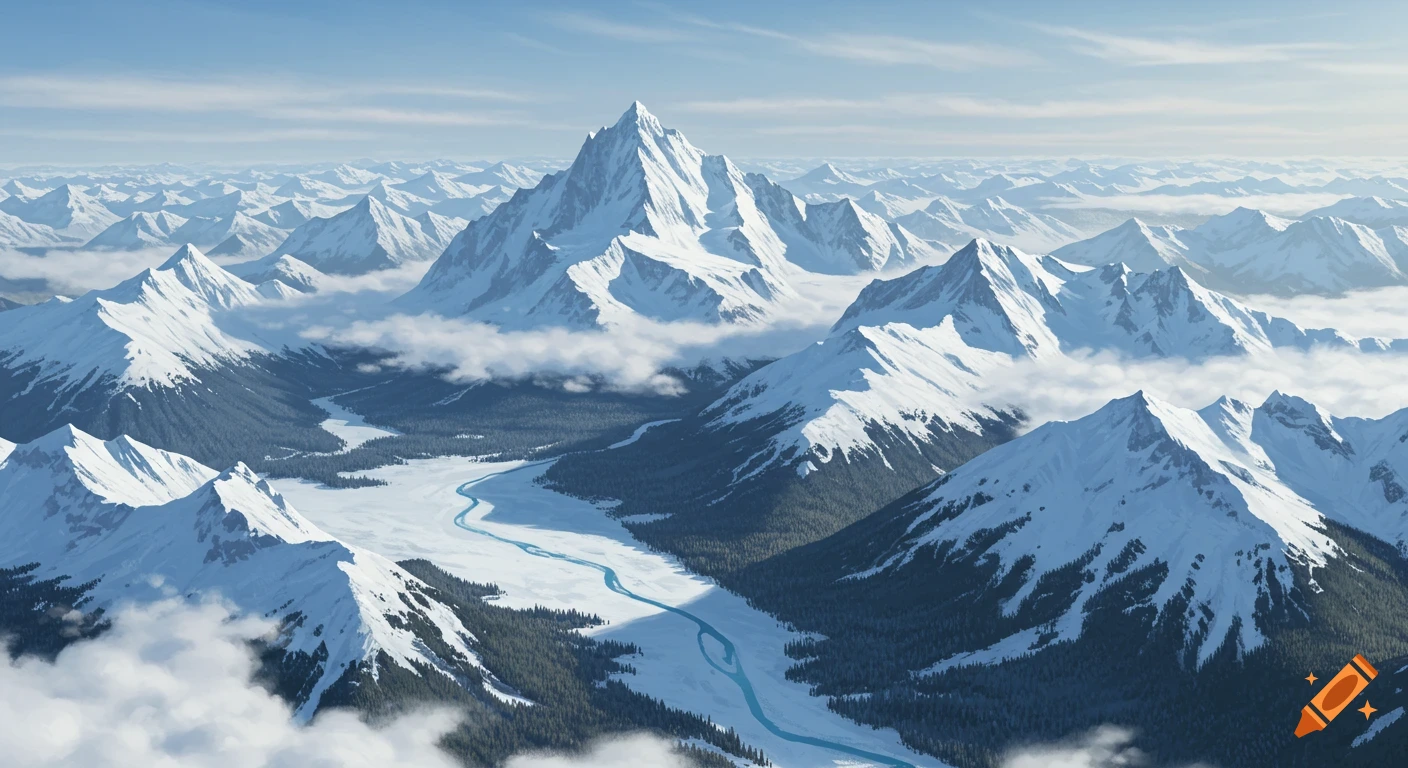
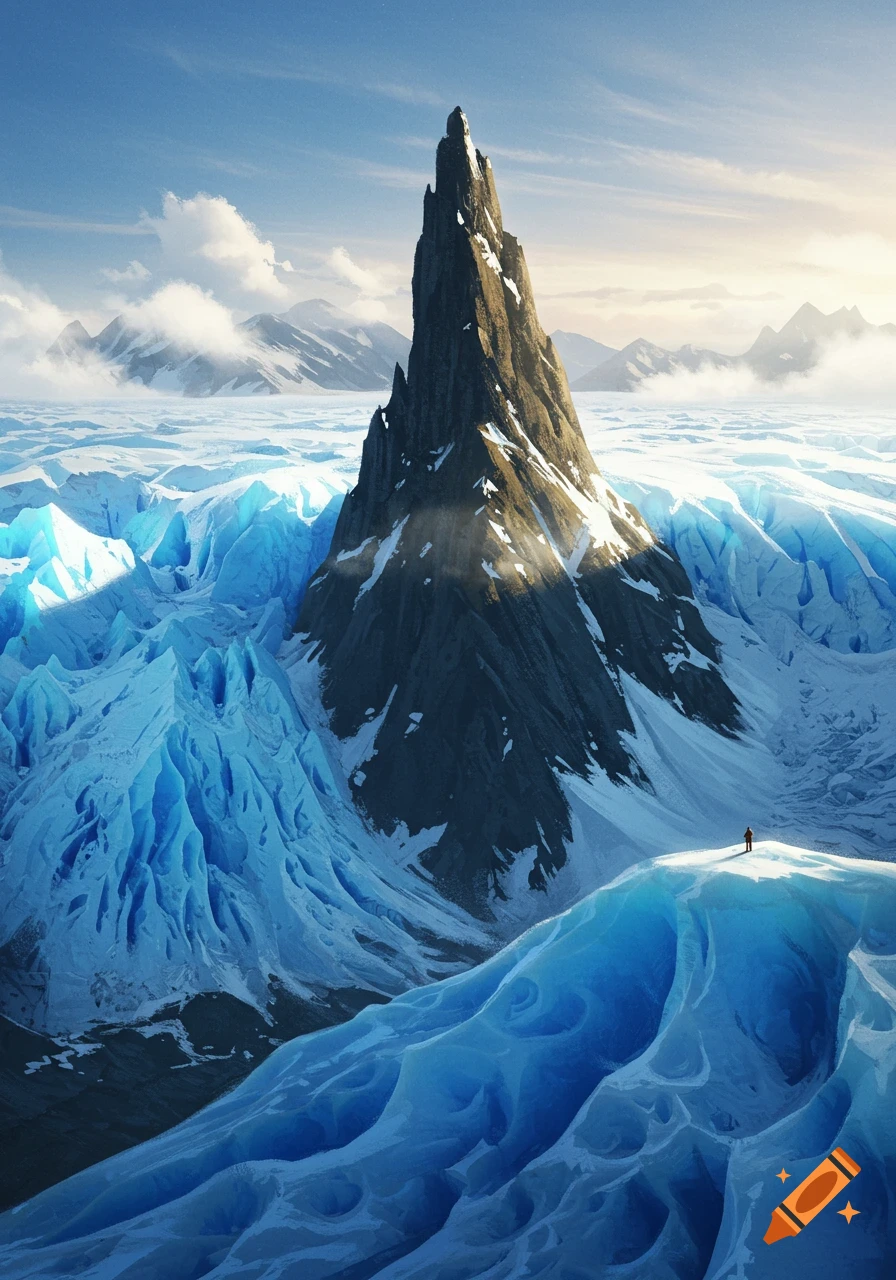
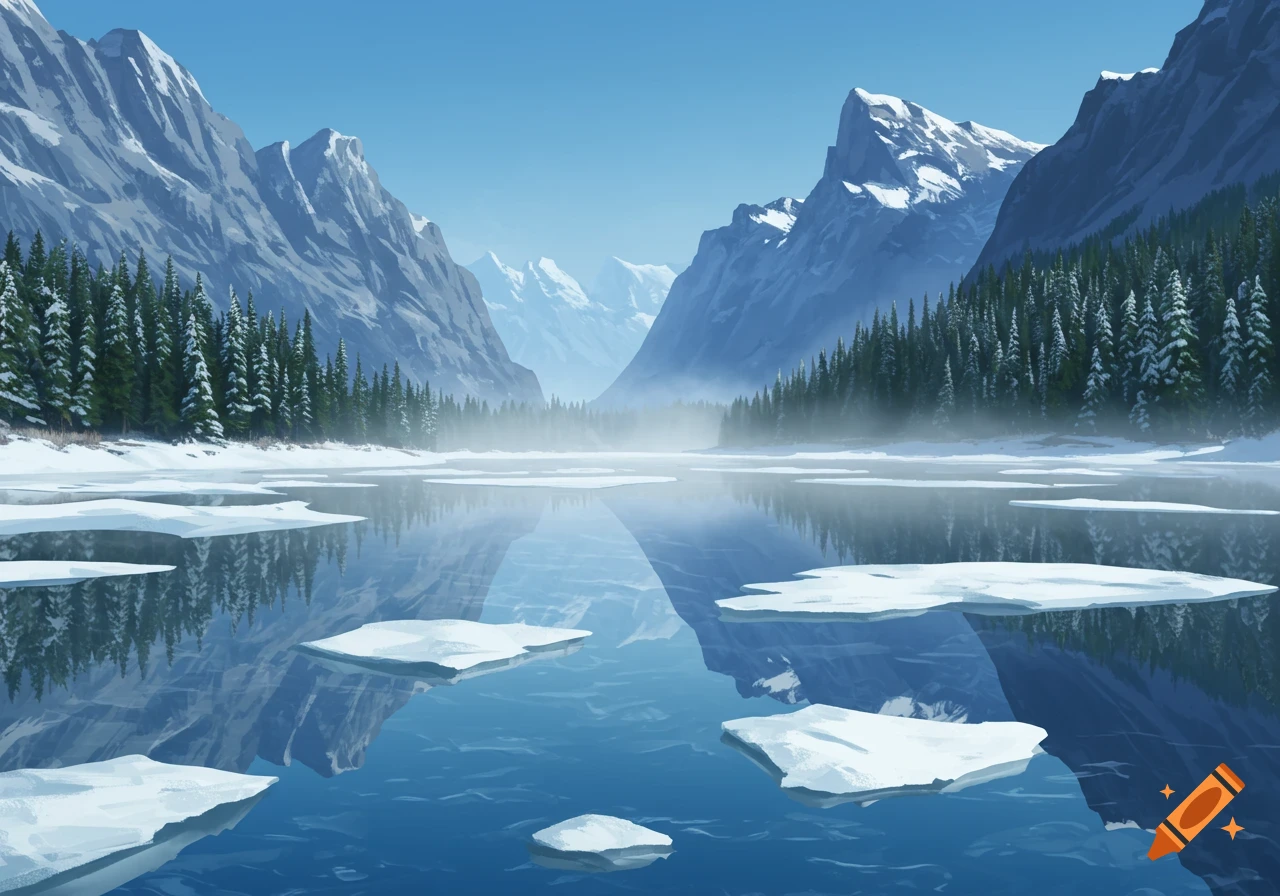
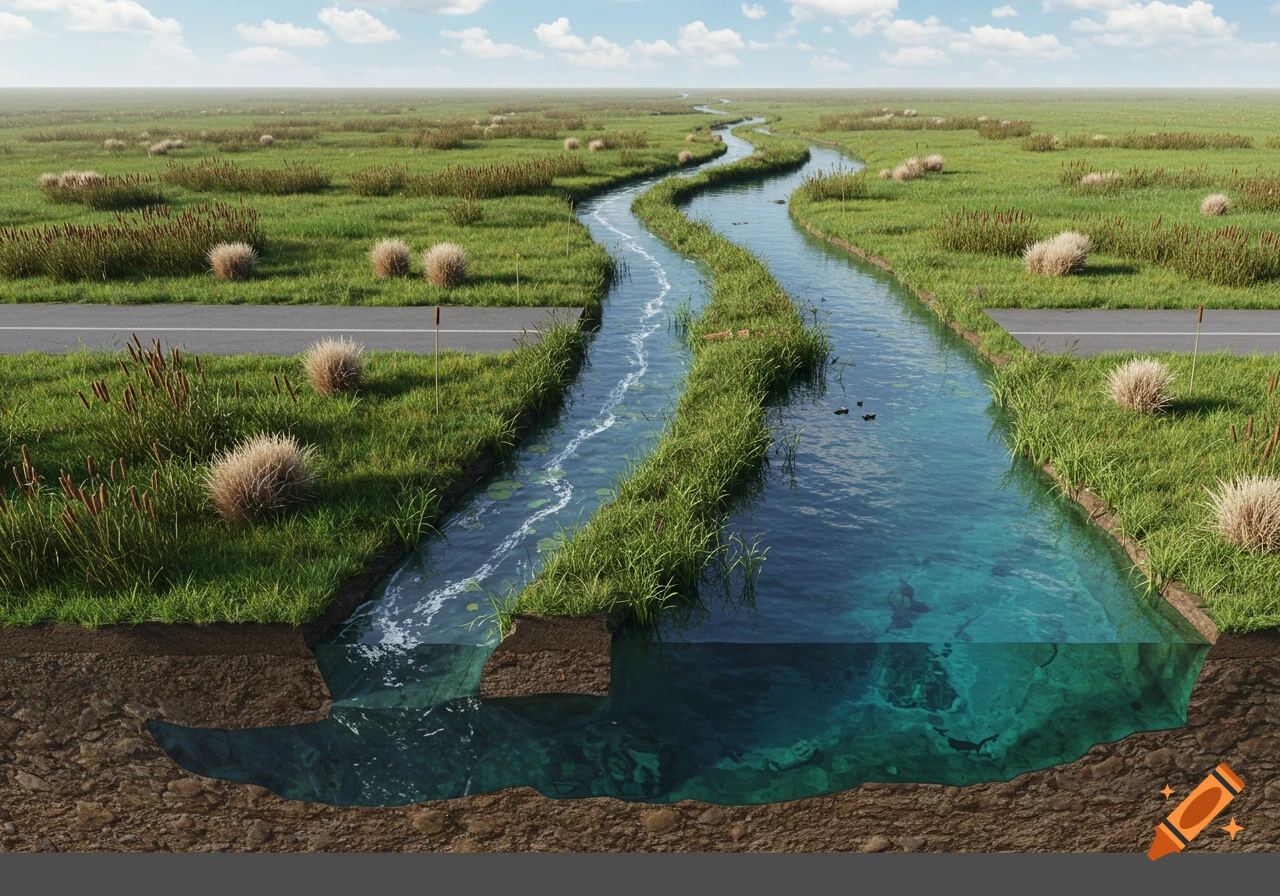
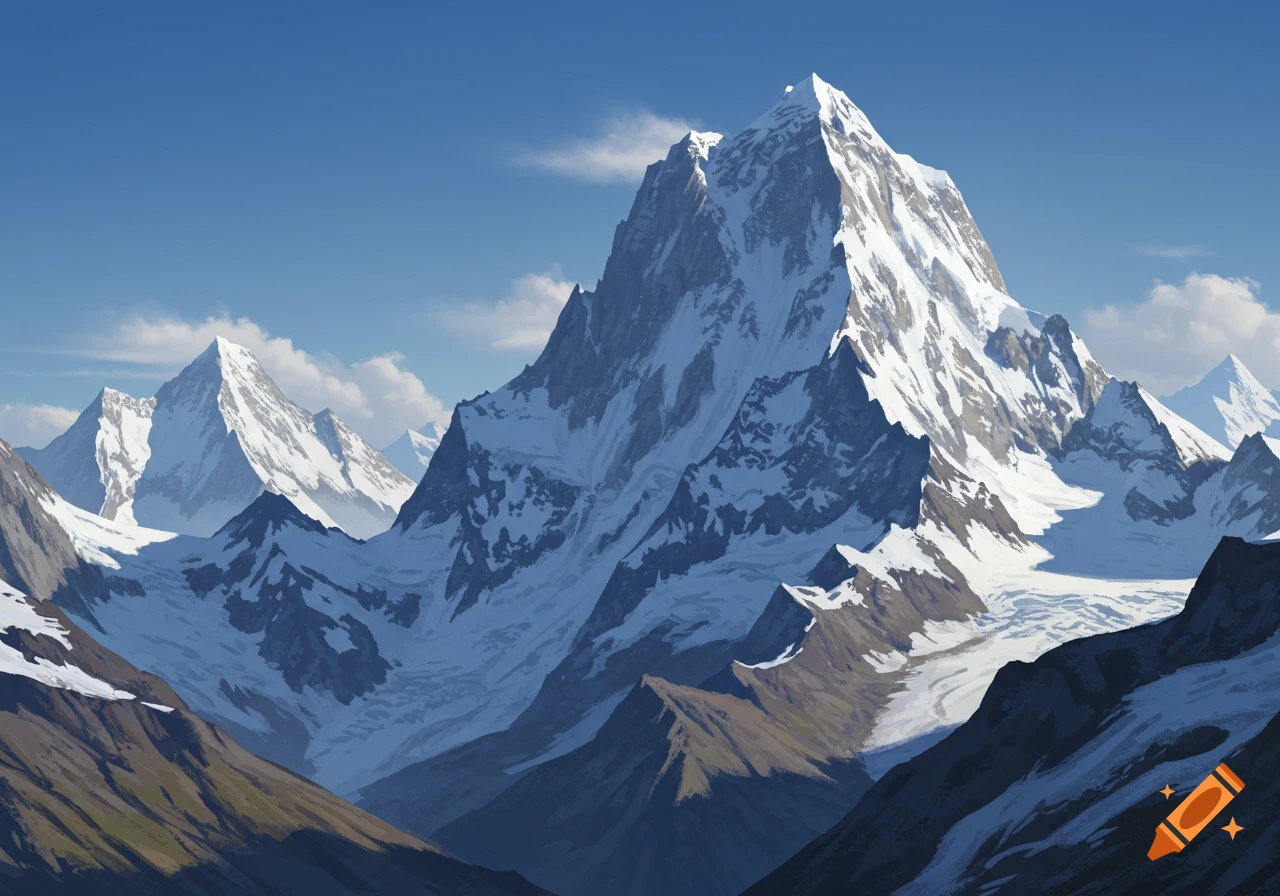
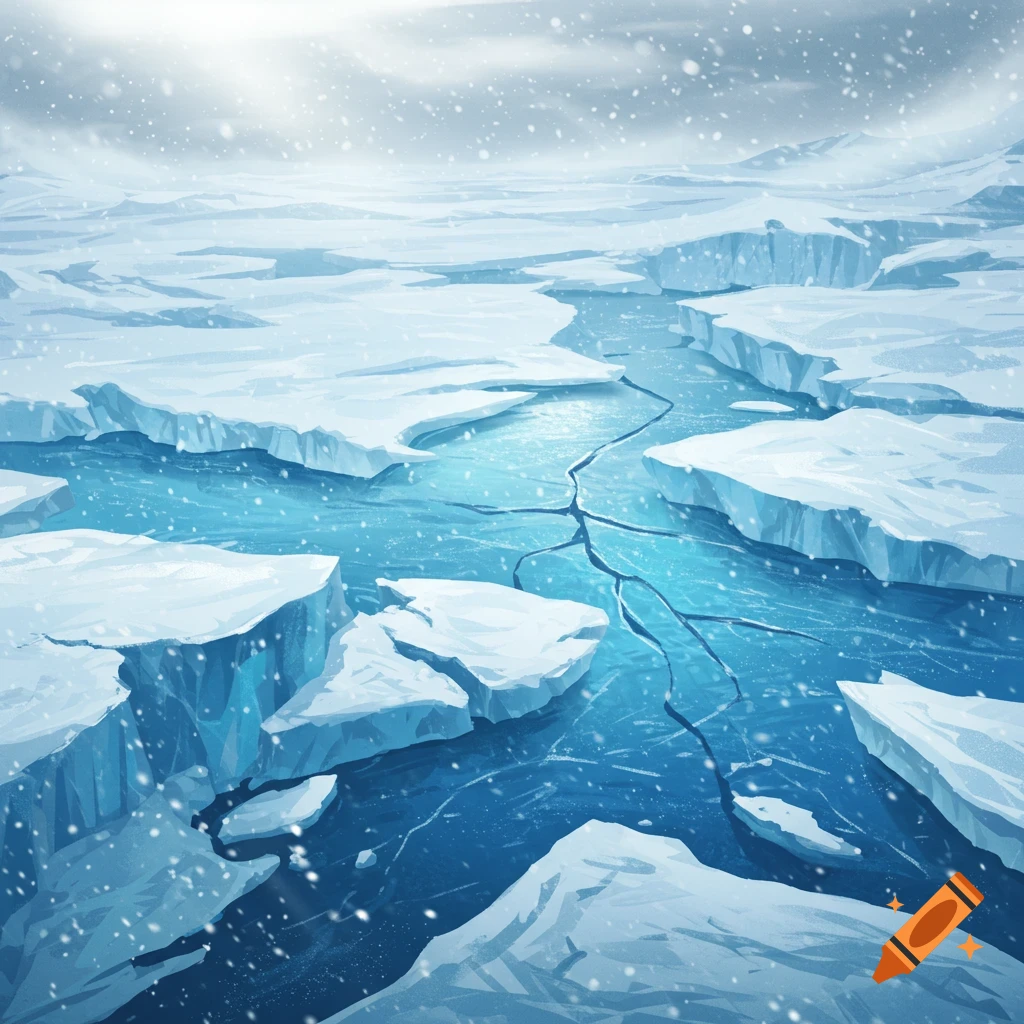
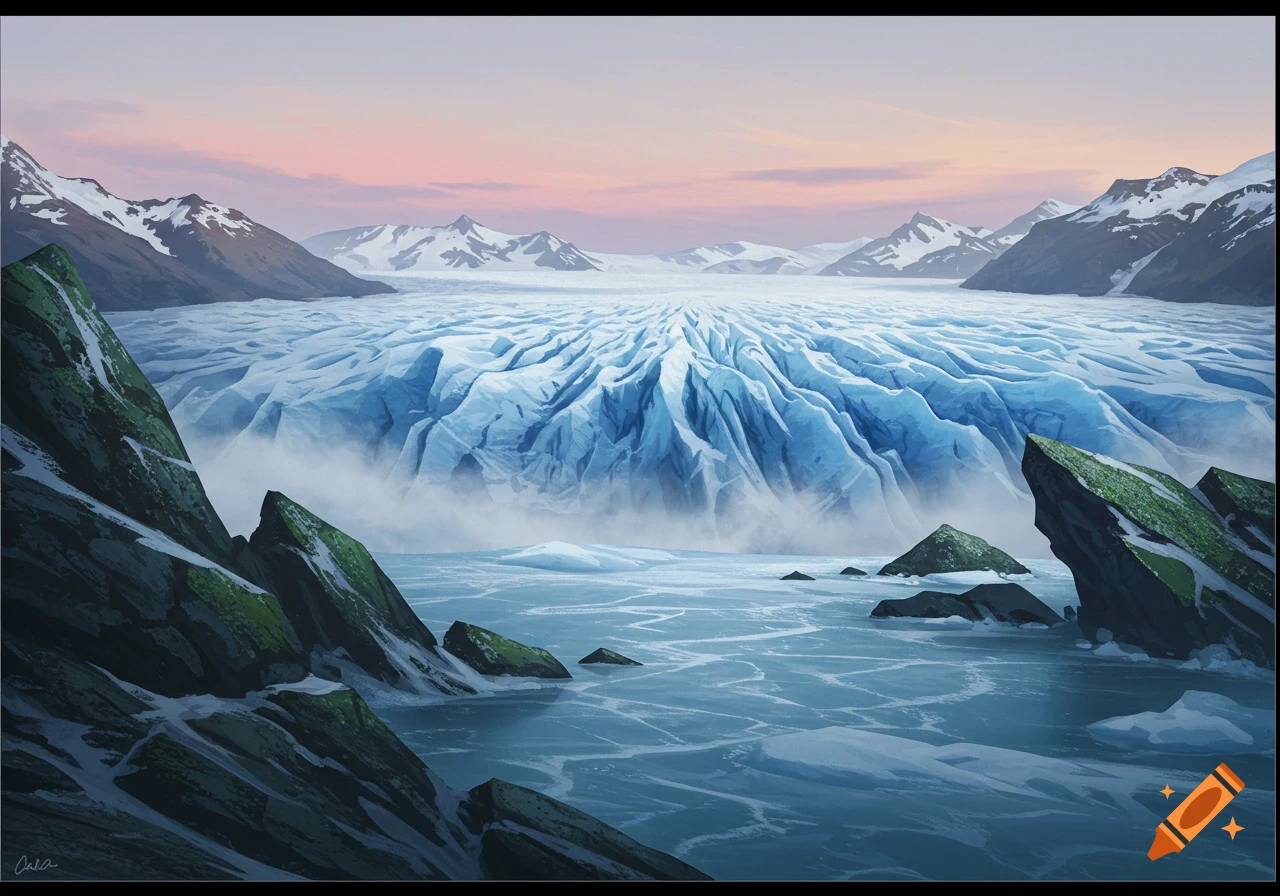
Scientific diagram illustrating glacial processes, tectonic feedback from ice mass, sea level drop, and atmosphere/biosphere connections.

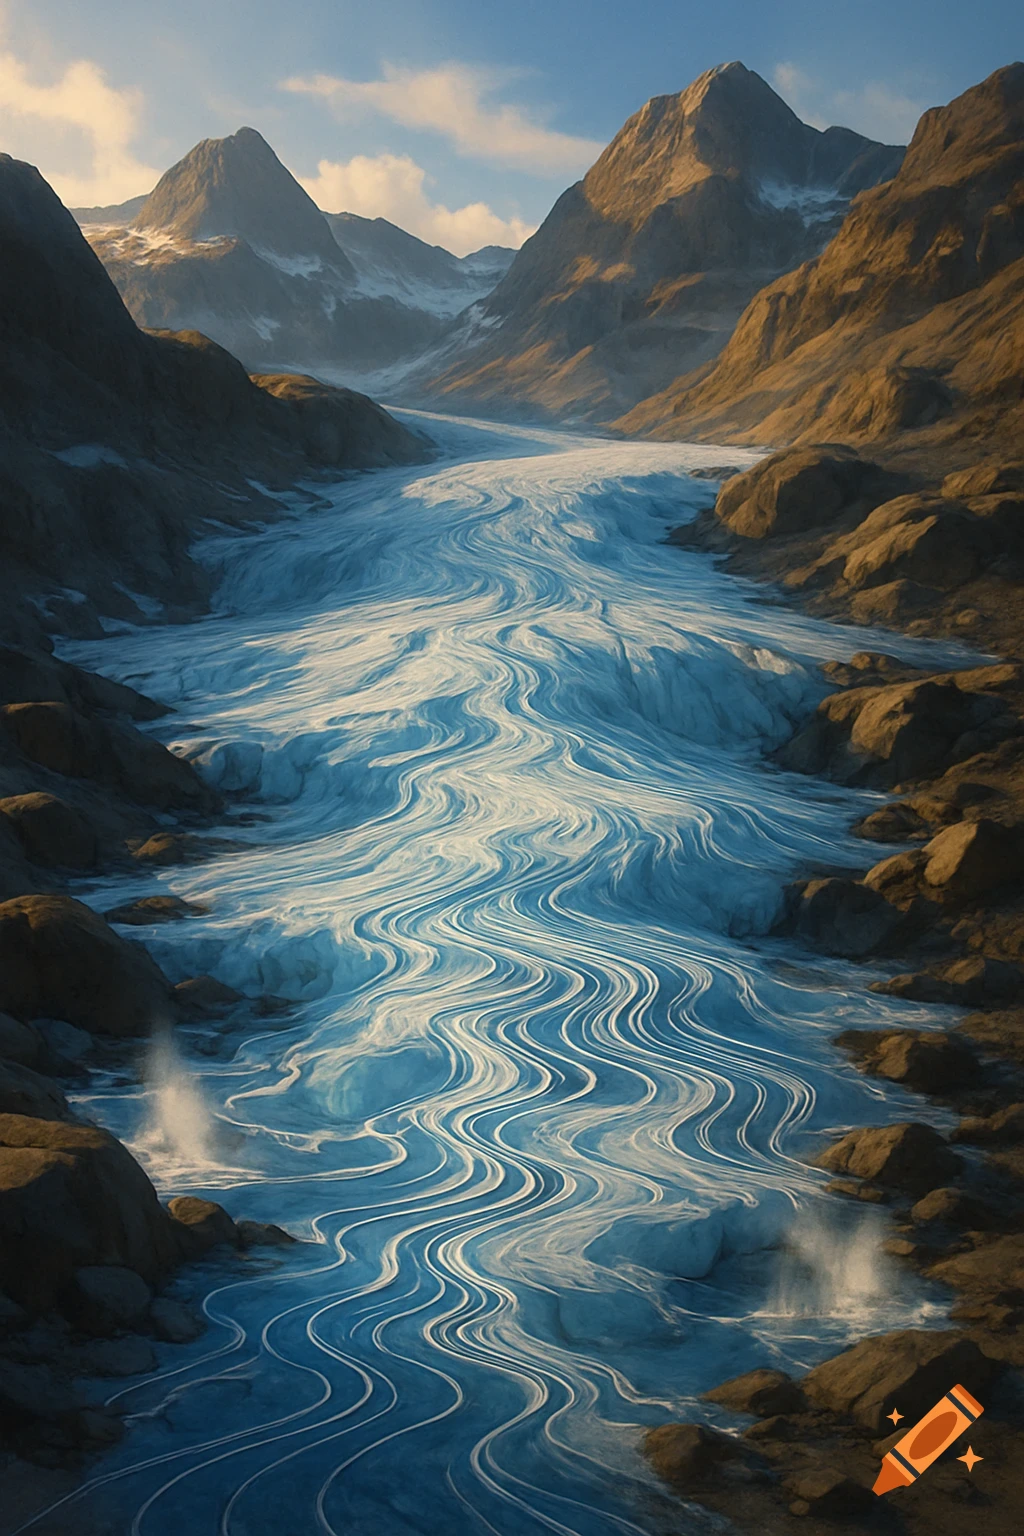
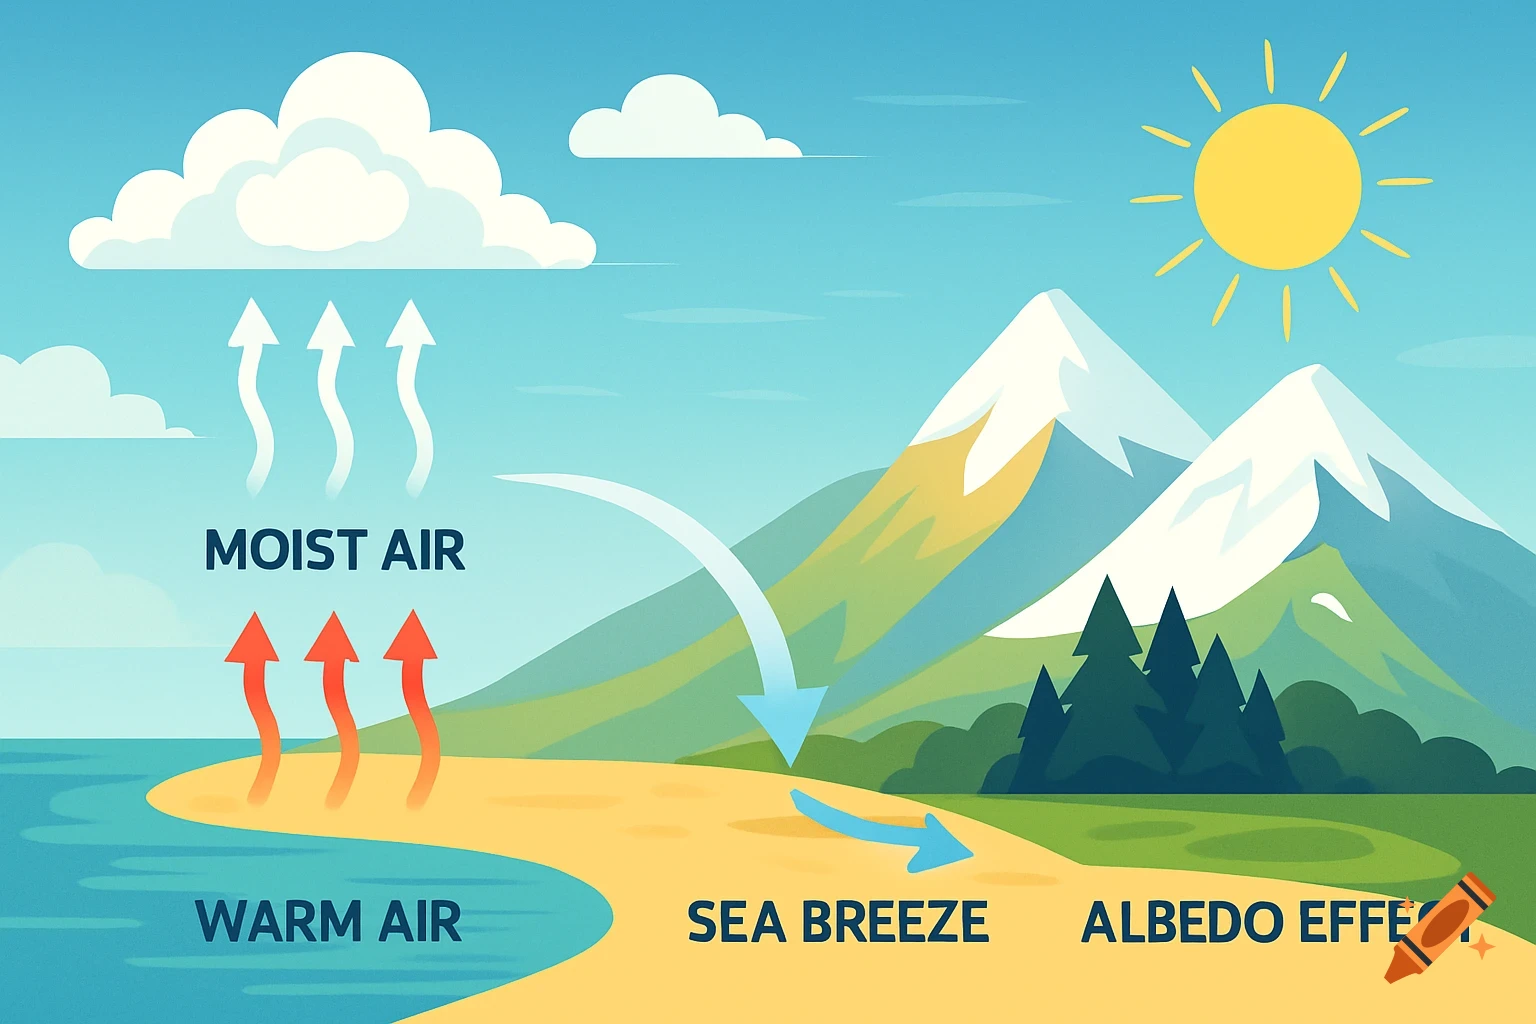
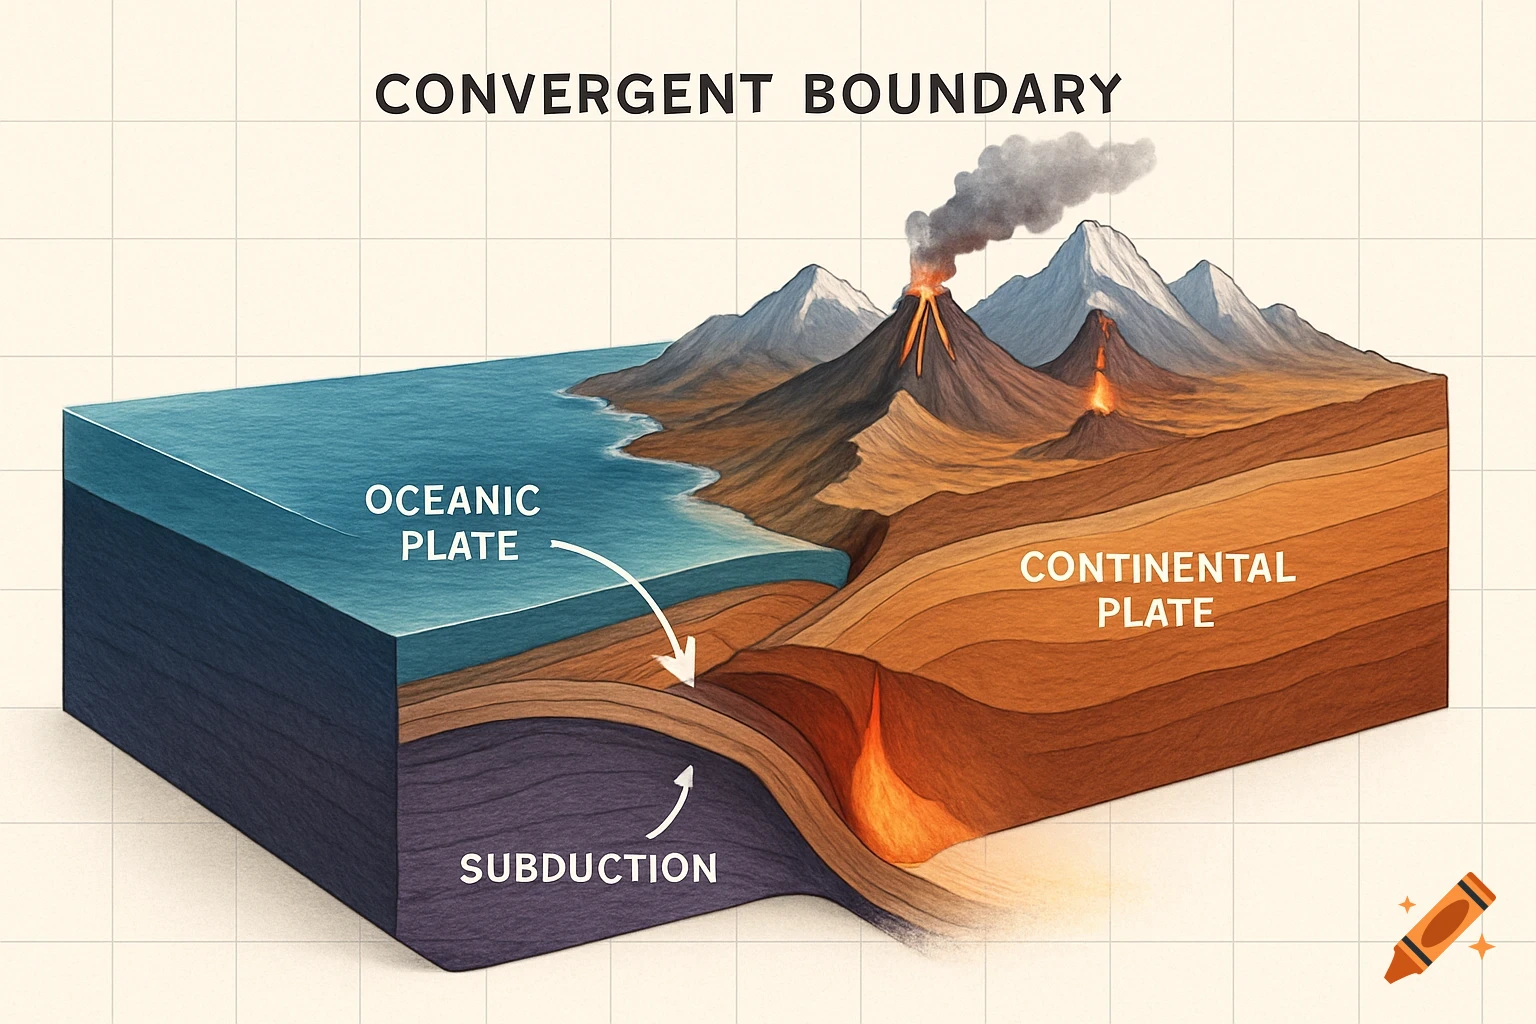
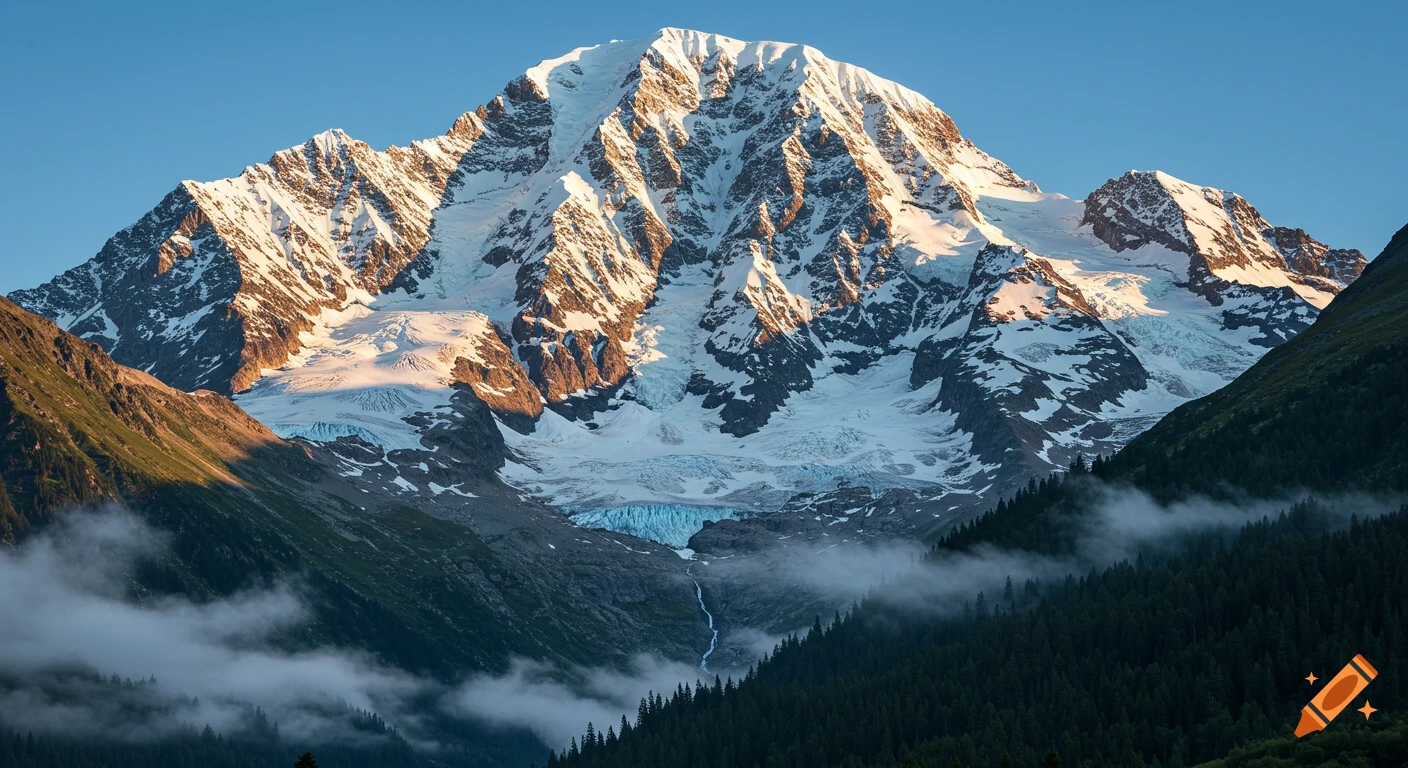
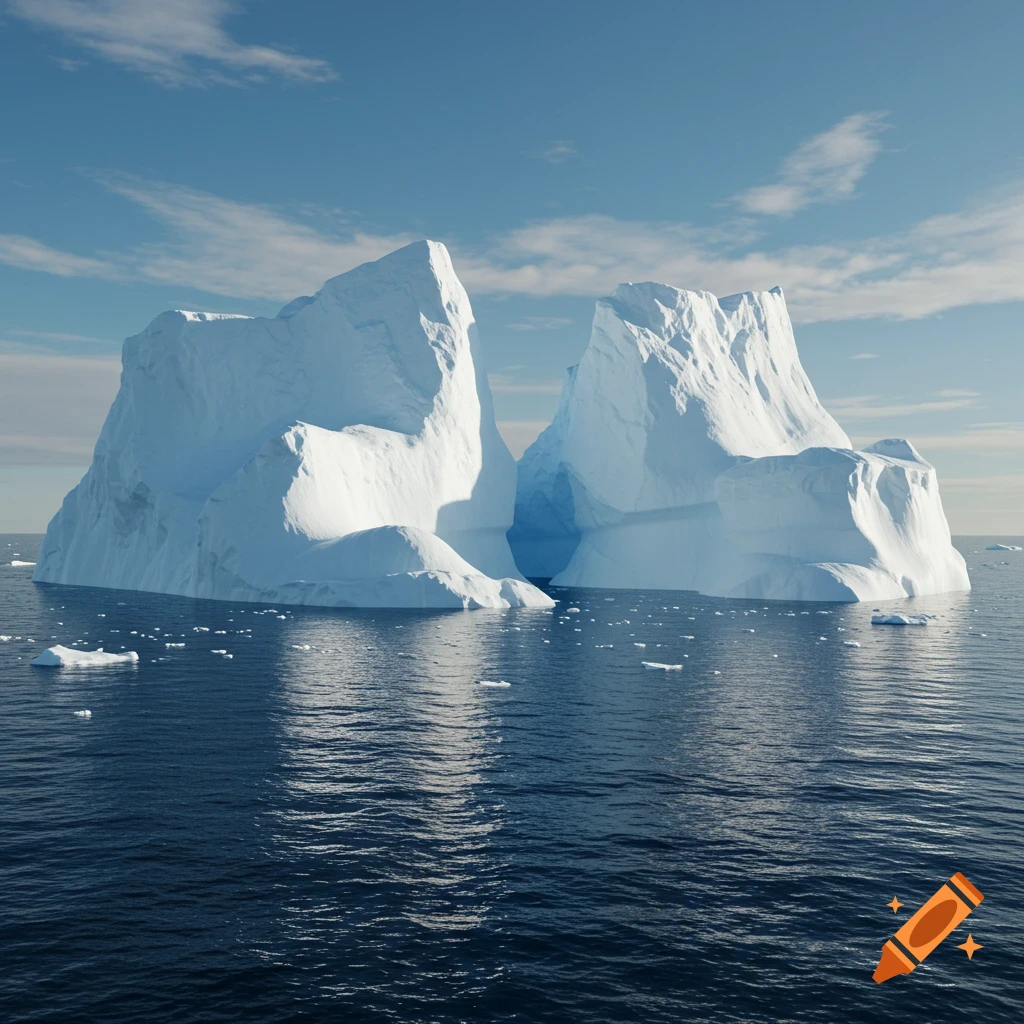
The Tectonic & Geosphere Frame: Draw a thick continental crust layer with a huge mountain range on the left. In the center, draw the crust bending slightly downward under a heavy block of blue/white ice, with small downward arrows labeled: Geosphere Tectonic Feedback: Colossal Ice Mass Causes Isostatic Crustal Depression. The Glacier & Rock Cycle (Center): Draw a large glacier flowing out from the mountains. At its base, draw dark jagged rocks scraping the bedrock. Label this zone: Rock Cycle: Powerful Mechanical Weathering (Plucking & Abrasion) Grinds Rock into Glacial Till. At the snout (front) of the glacier, draw a chaotic pile of mixed gravel and sediment labeled: Depositional Tillite & Outwash Layers $\rightarrow$ Future Sedimentary Rock. The Ocean & Sea Level Drop (Right Side): On the far right, draw an ocean coastline. Draw a dashed line high up labeled Pre-Glacial Sea Level and a solid waterline much lower down labeled Hydrosphere Impact: Global Sea Level Drops 120m $\rightarrow$ Exposes Land Bridges. The Atmosphere & Biosphere Loops (Top & Bottom): * In the sky above the ice, draw yellow sun rays bouncing completely off the glacier back into space, labeled: Atmosphere Loop: High Albedo Reflects Sunlight $\rightarrow$ Drives Positive Feedback Global Cooling. In the ocean on the right, draw arrows showing clouds of fine dust blowing off the land into the water, with little green dots drawn near the surface, labeled: Biosphere Connection: Glacial Rock Flour Dust Mehr sehen
More images like this