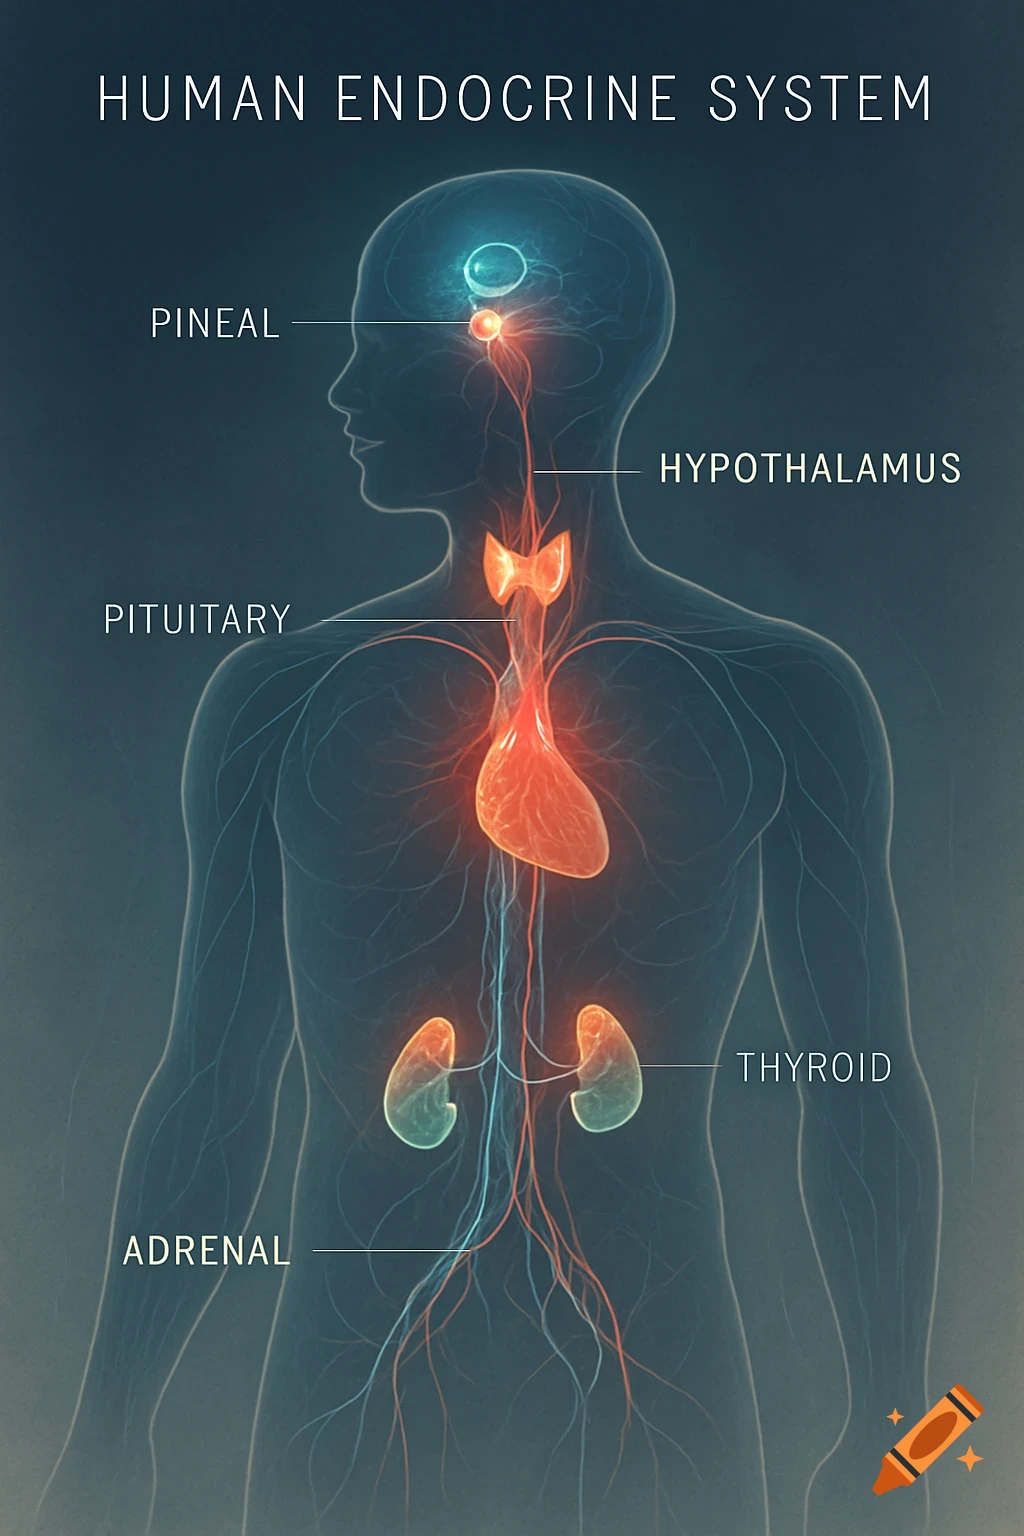
A scientific diagram explaining pituitary growth hormone and mitochondrial MOTS-c, with labels and arrows.

Create a clear educational diagram comparing pituitary growth hormone (GH) stimulation versus mitochondrial MOTS-c action. Left side: show a pituitary gland in the brain releasing GH into the bloodstream with arrows pointing to muscle, fat, and bone, labeled. Right side: show mitochondria inside cells being optimized by MOTS-c, improving energy production, insulin sensitivity, and metabolism, with arrows and labels. Include colorful, easy-to-read labels, arrows showing the pathways, minimal text, clean diagram style suitable for learning. Mehr sehen
More images like this