A two-panel scientific illustration showing confidence distribution and training batch composition with charts, squares, and chair icons.
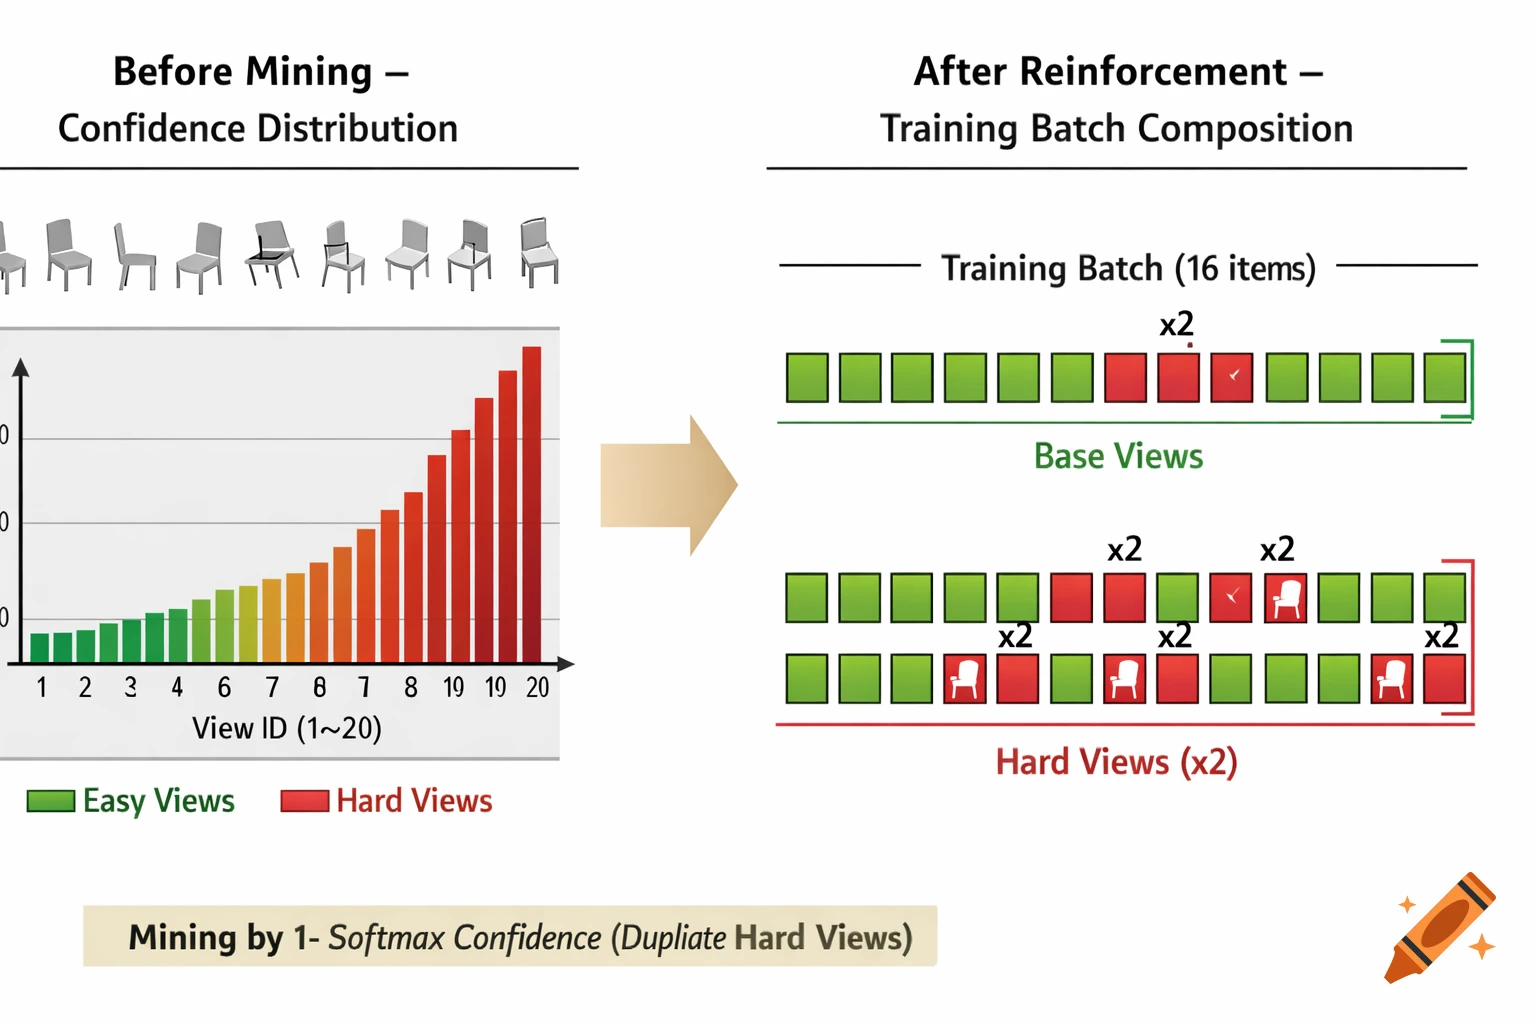
Create a clean, professional scientific illustration in the style of machine learning paper figures, divided into two panels with an arrow in the middle. Left panel title: "Before Mining – Confidence Distribution" - Horizontal bar chart with X-axis labeled "View ID (1~20)" showing 20 bars. - Y-axis labeled "1 - Confidence (higher = harder)" upward arrow. - Most bars are short and green, labeled "Easy Views" at the bottom with low bars. - A few bars (e.g., 4 bars) are tall and red, grouped together, labeled "Hard Views" with chair icons above the tall red bars (simple 3D chair silhouettes from different angles). - Color gradient: green for low values (easy), red for high values (hard). - Background light gray, clean style. Middle: A large beige arrow pointing right, with text inside: "Mining by 1 - Softmax Confidence (Duplicate Hard Views)" Right panel title: "After Reinforcement – Training Batch Composition" - Show two rows of a training batch with 16 small squares (like data samples). - Top row: mostly green squares, some marked "x2" in red for duplicated hard views, labeled "Base Views" on the left with green bracket. - Bottom row: mix of green and more red squares marked "x2", labeled "Hard Views (x2)" with red bracket on the right. - Overall label "Training Batch (16 items)" at the top. - Add small chair icons on some red squares to indicate views. Overall style: Vector graphic, high contrast, academic paper figure style (like from CVPR or NeurIPS), white background, Mehr sehen
More images like this