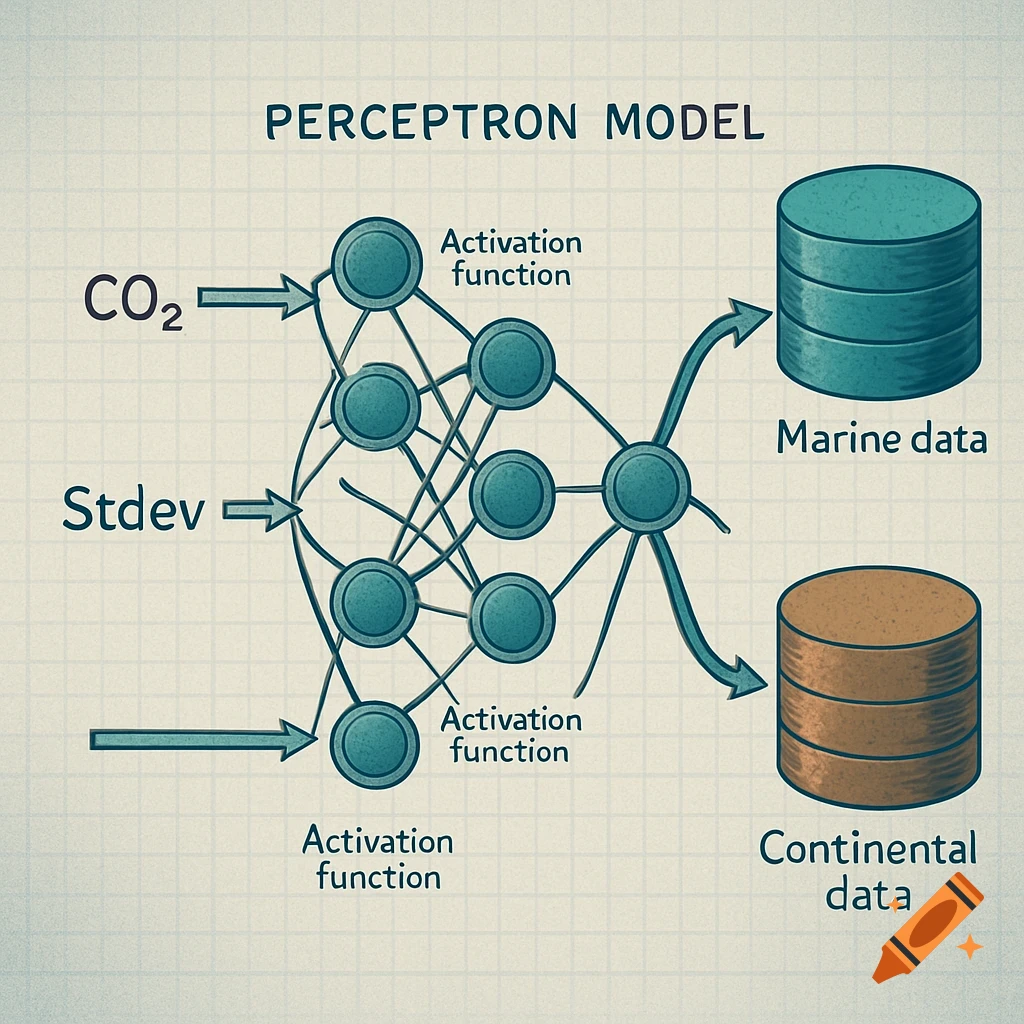
A business process flow diagram illustrating DataOps, Advanced Analytics, BI, and Platform teams' roles across Ingestion, Transformation, Feature Engineering, Modeling, BI Reporting, and Deployment stages, with handoff triggers.

you have four swimlanes: one for DataOps, one for Advanced Analytics, one for BI, and one for the platform team. Along the top, you have a timeline or lifecycle stages: Ingestion, Transformation, Feature Engineering, Modeling, BI Reporting, and Deployment. In each stage, place visual markers or icons—like arrows, task blocks, or labels—to indicate what each team is responsible for at that stage. Then, draw handoff lines—horizontal arrows—between teams to show where ownership transitions. Below each handoff, add a label that says something like “Handoff Trigger: Business Validation Complete” or “Model Deployed Successfully.” Finally, you can use callouts or text boxes to tie each stage to the user business requirements. For instance, a callout near the BI stage could say, “This is where user dashboards are validated against business KPIs.” By showing the flow from business request, through each team’s specialized work, and finally to a handoff that ties back to business impact, you keep both clarity and accountability front and center. Once you structure it this way, it will be really easy to walk the manager through it, showing how each team’s accountability evolves from ingestion to insights. Mehr sehen
More images like this