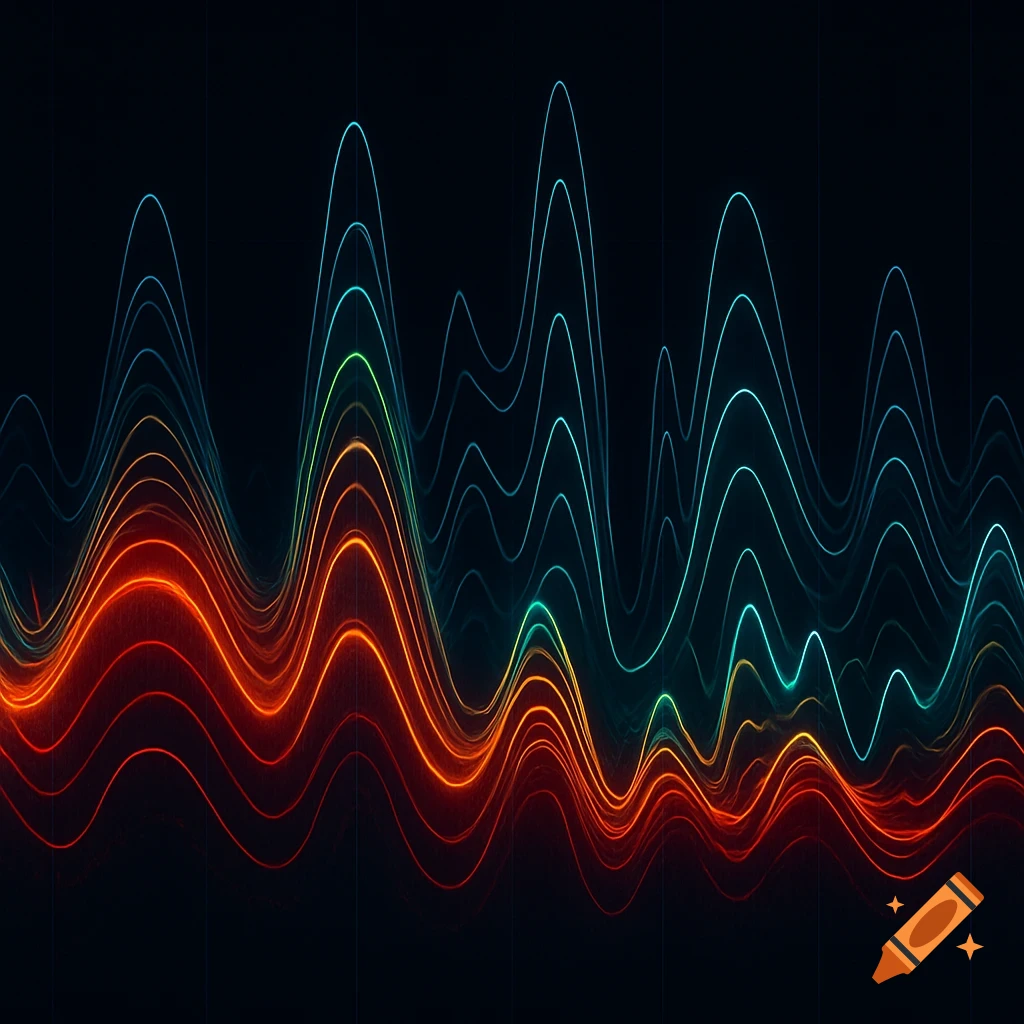
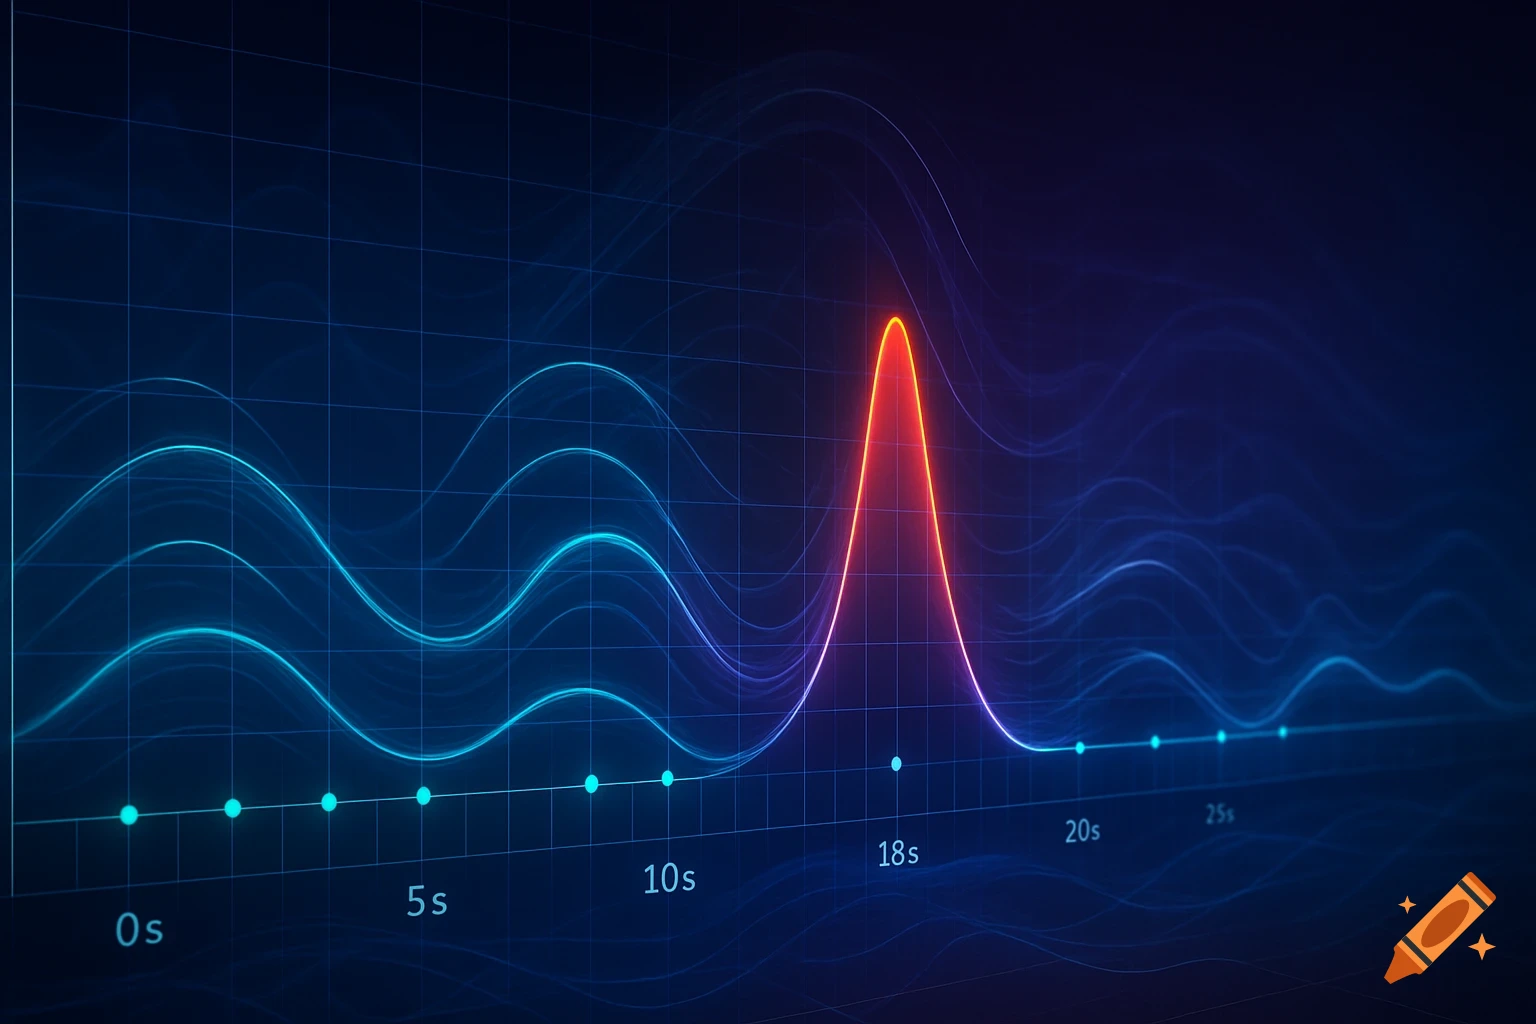
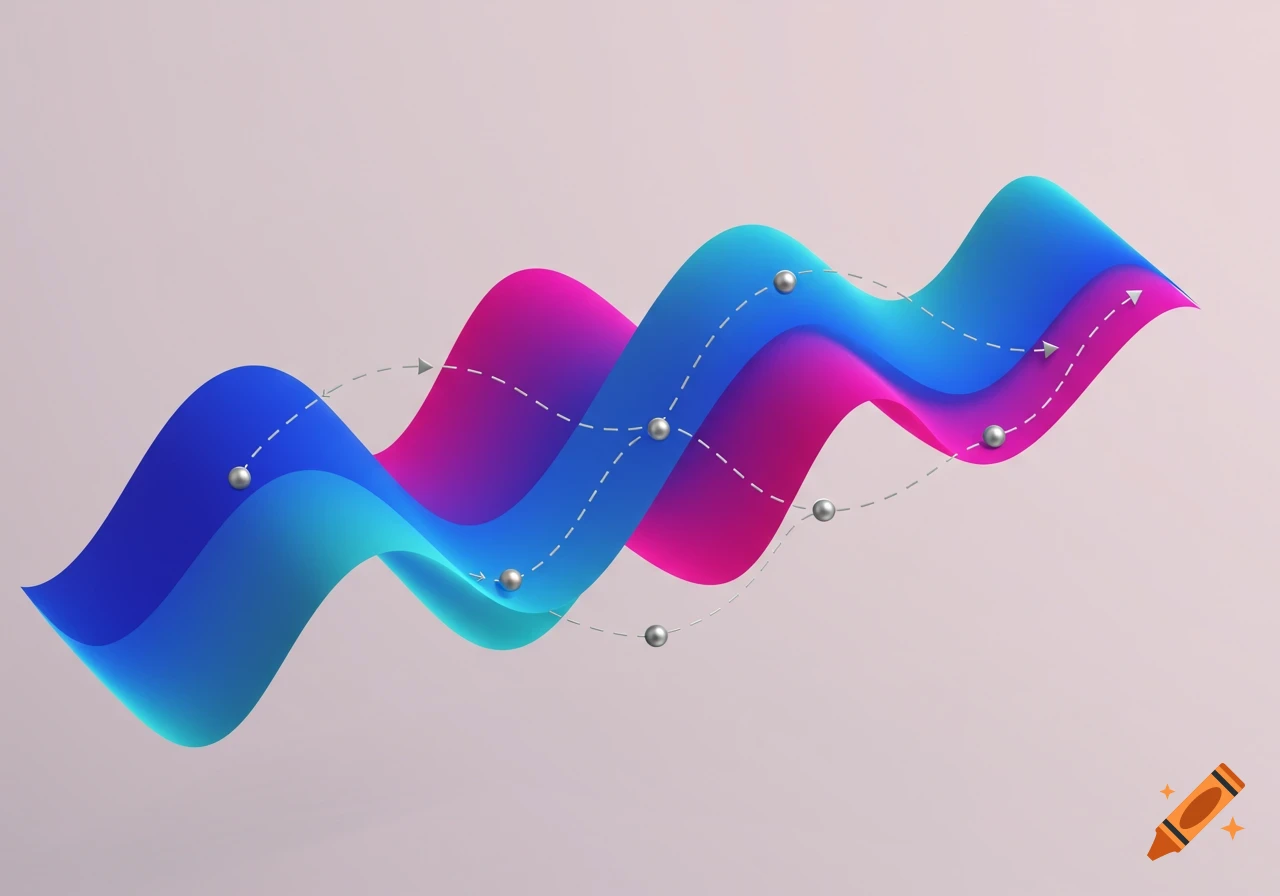
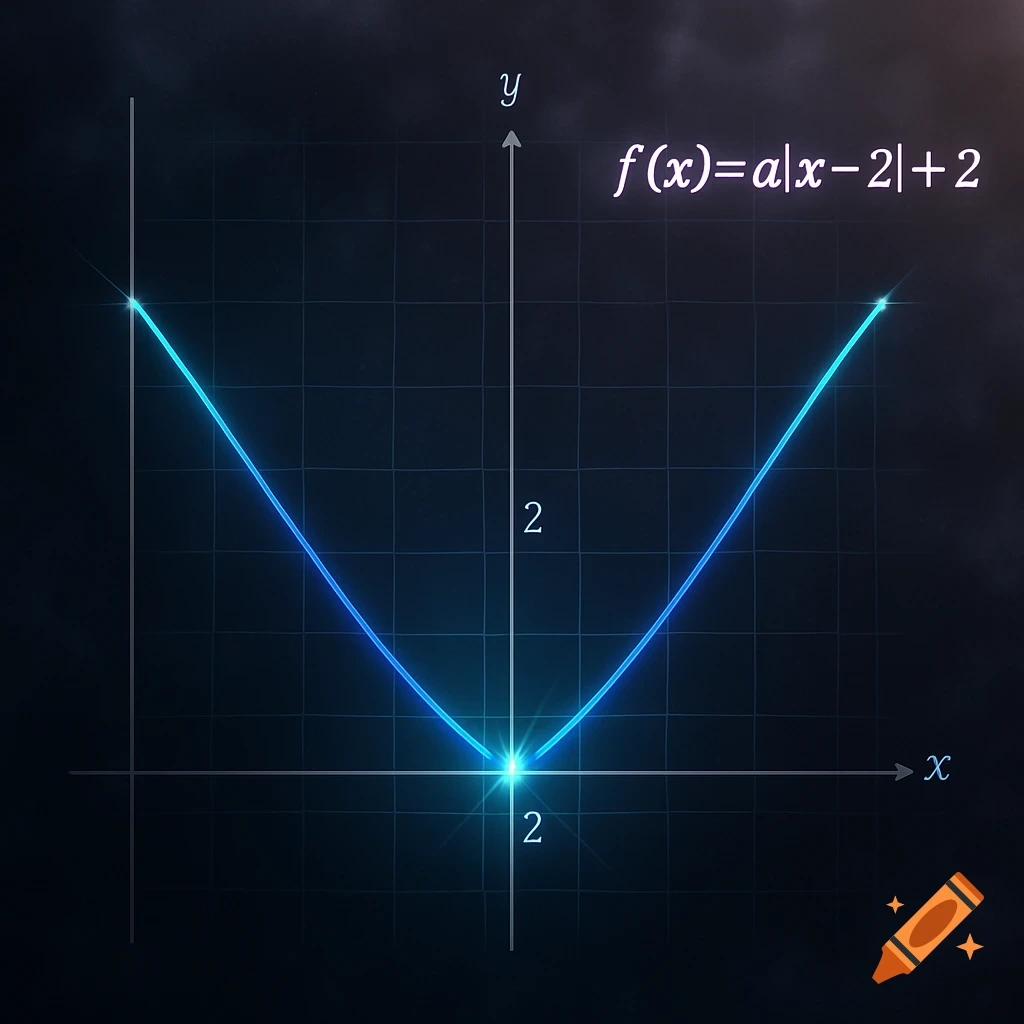
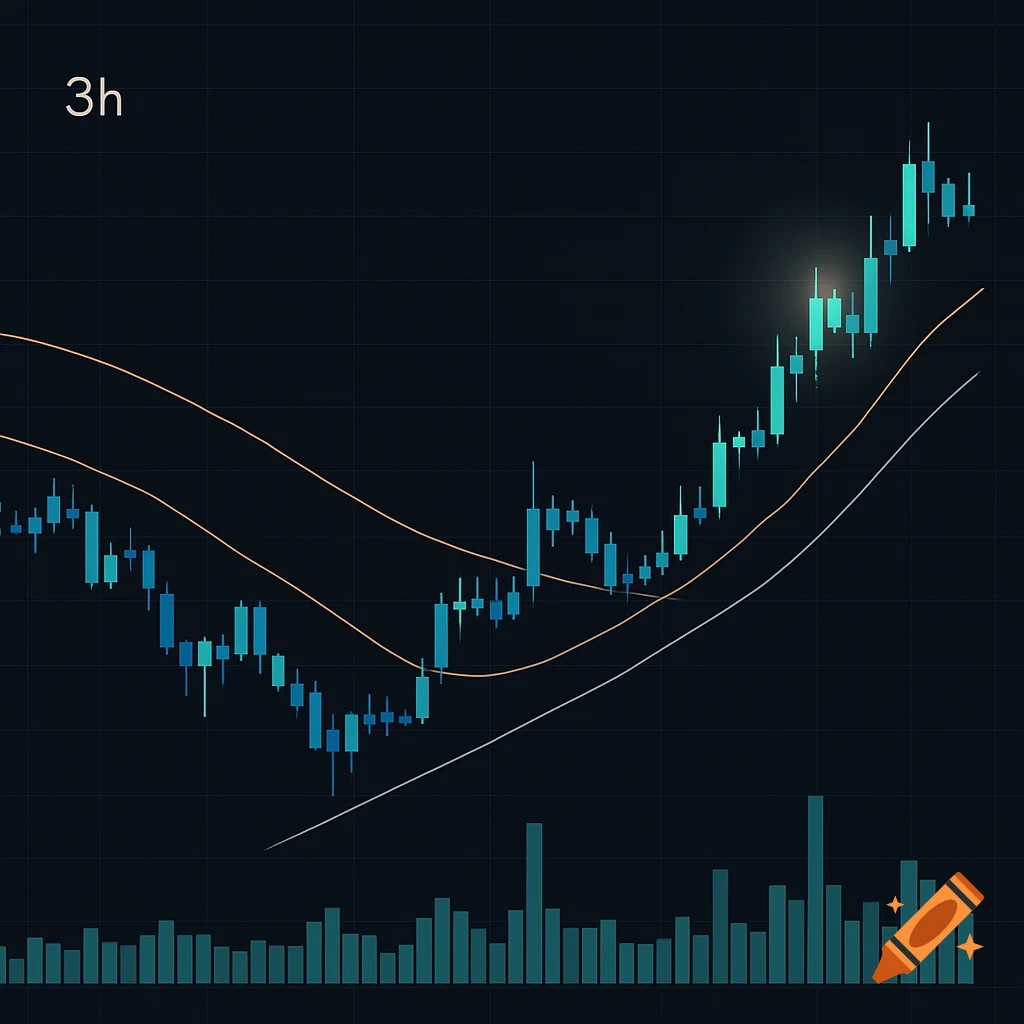
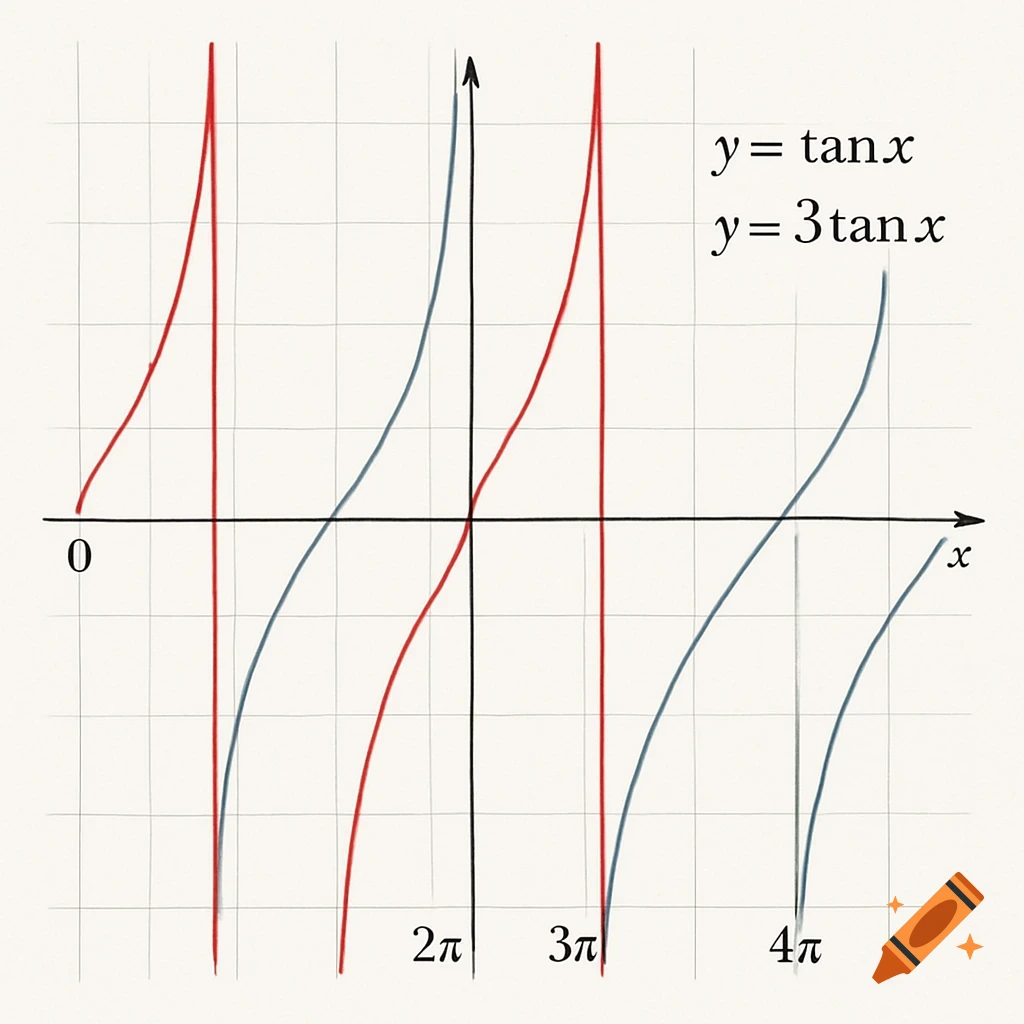
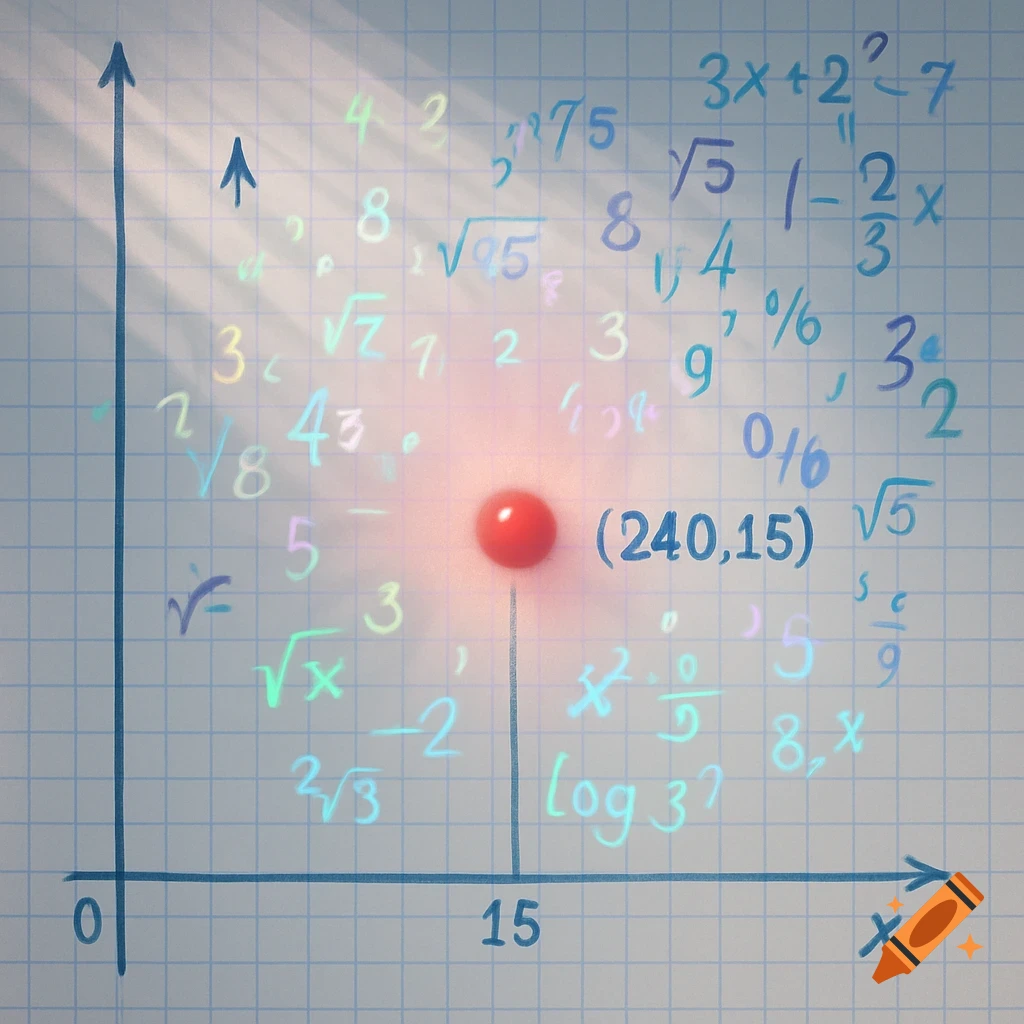
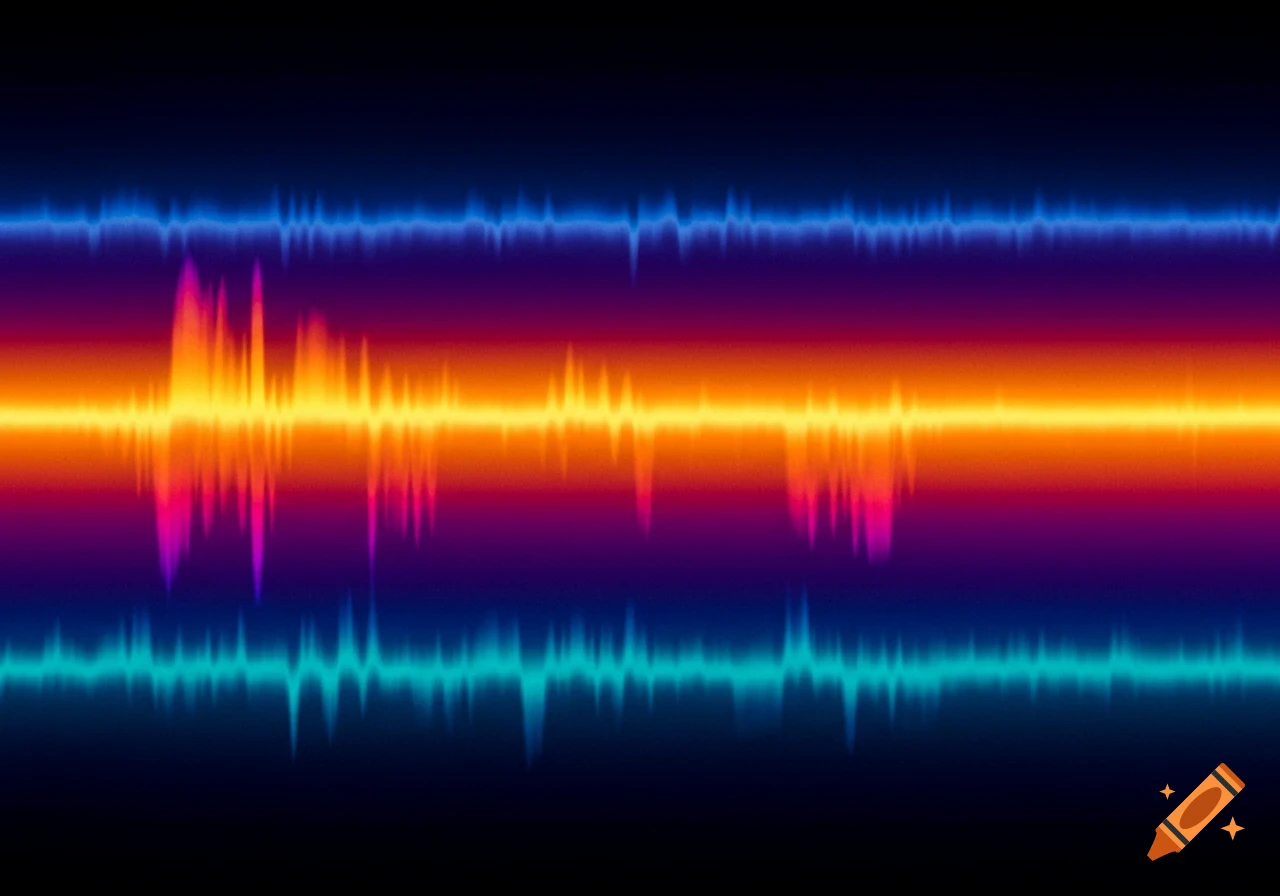
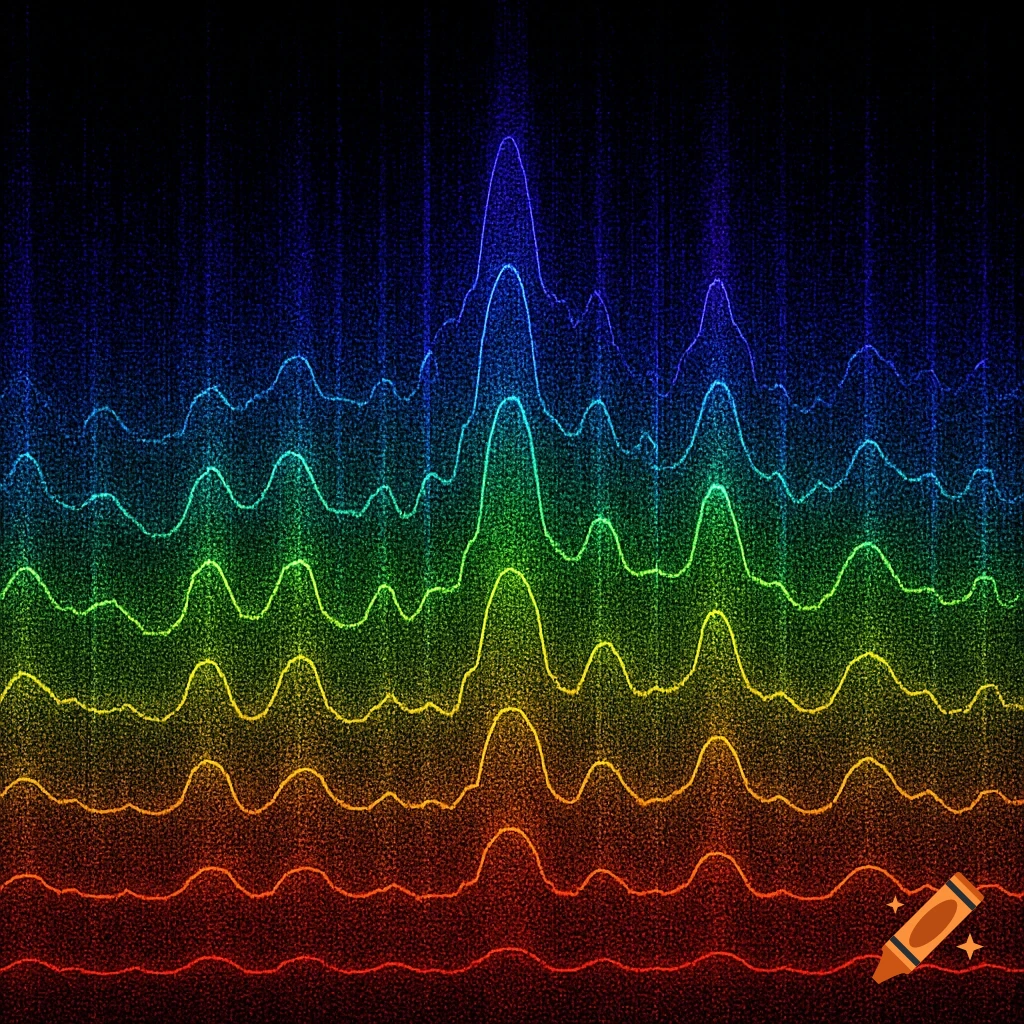
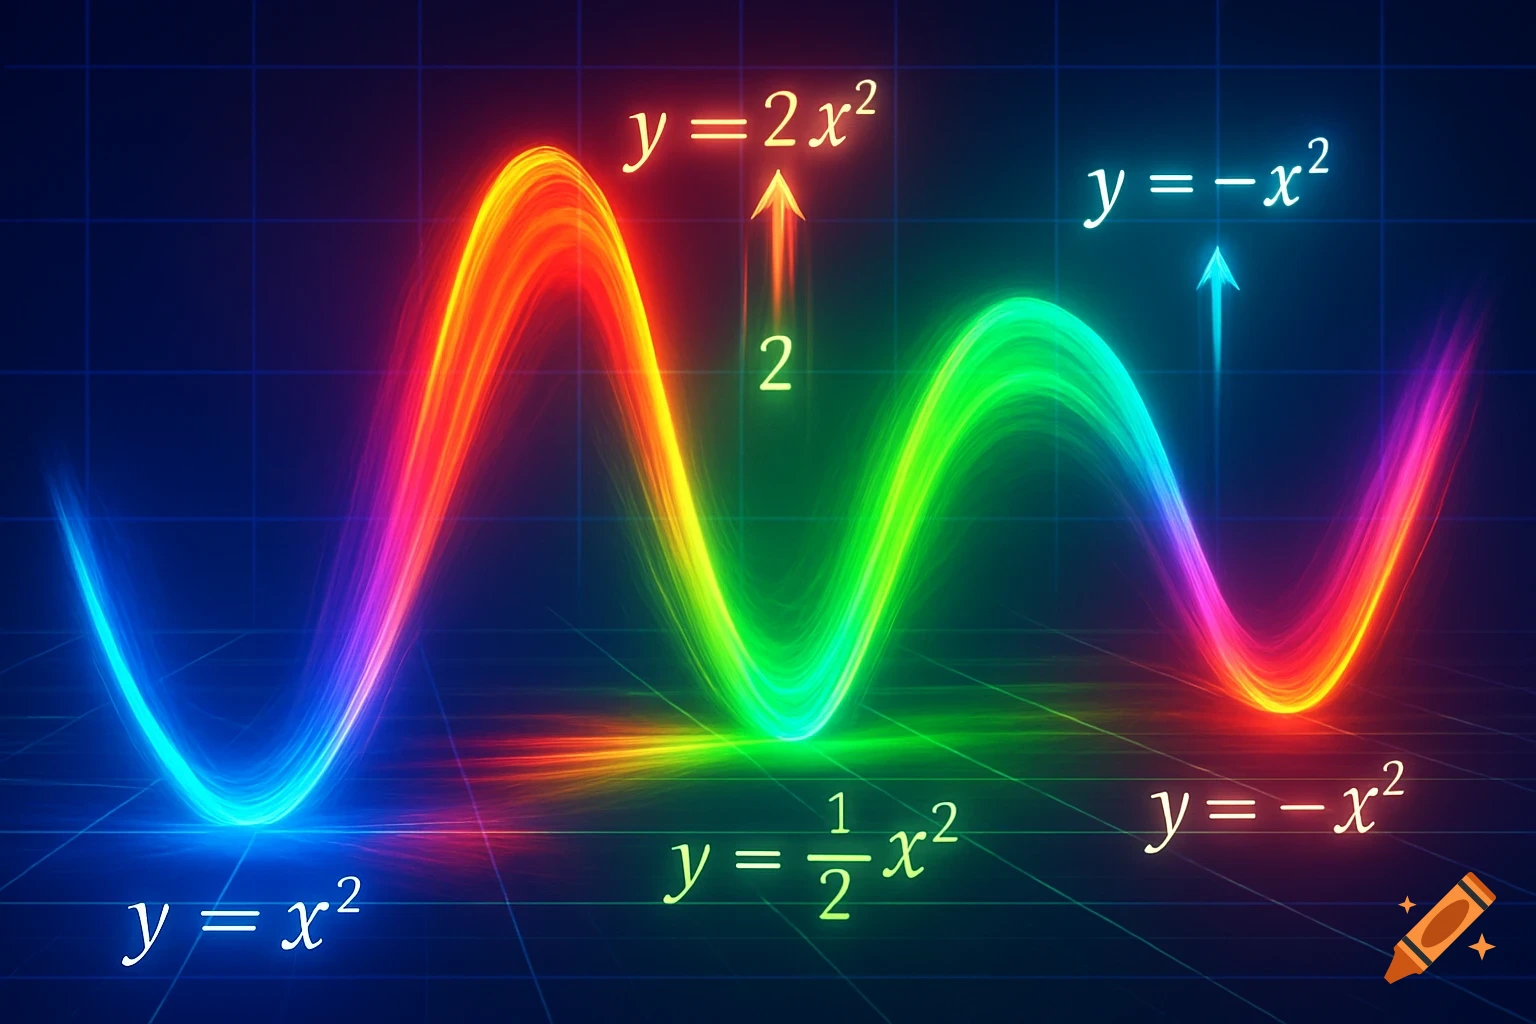
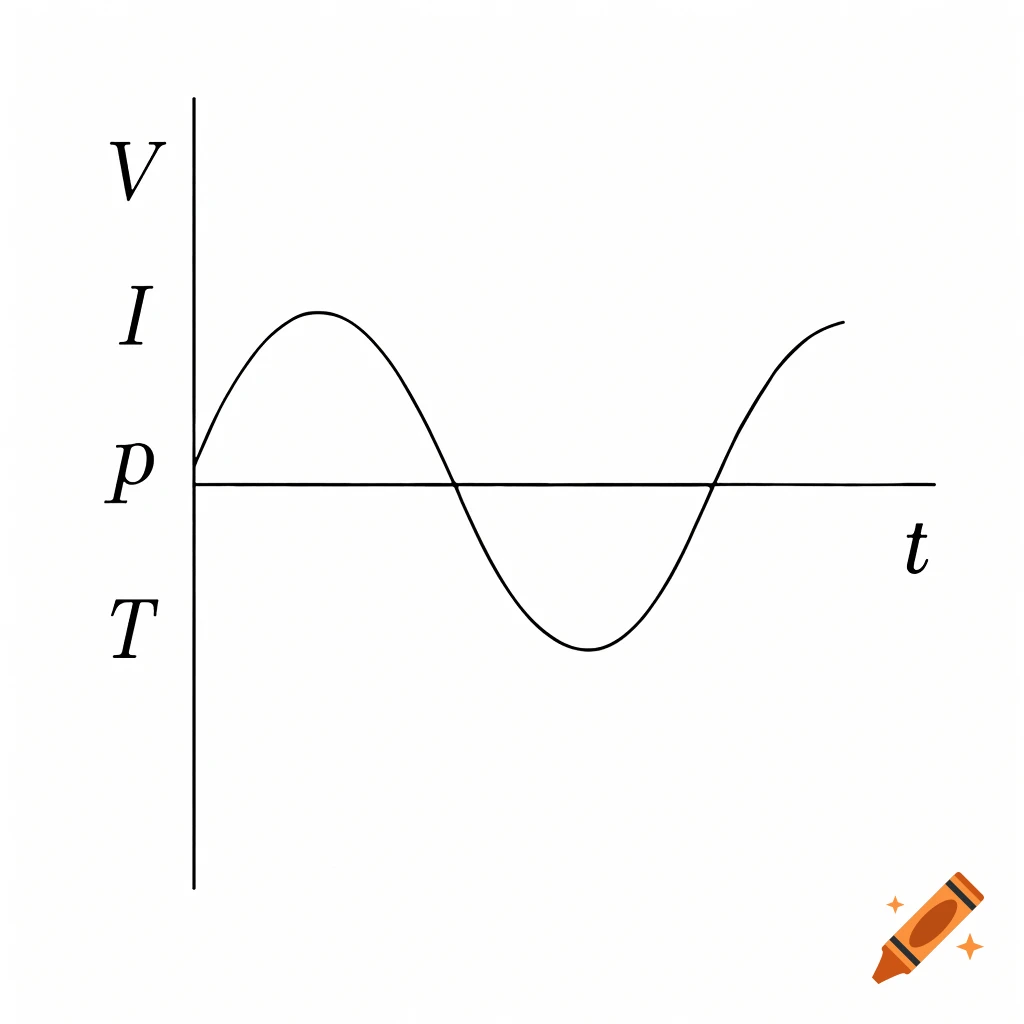
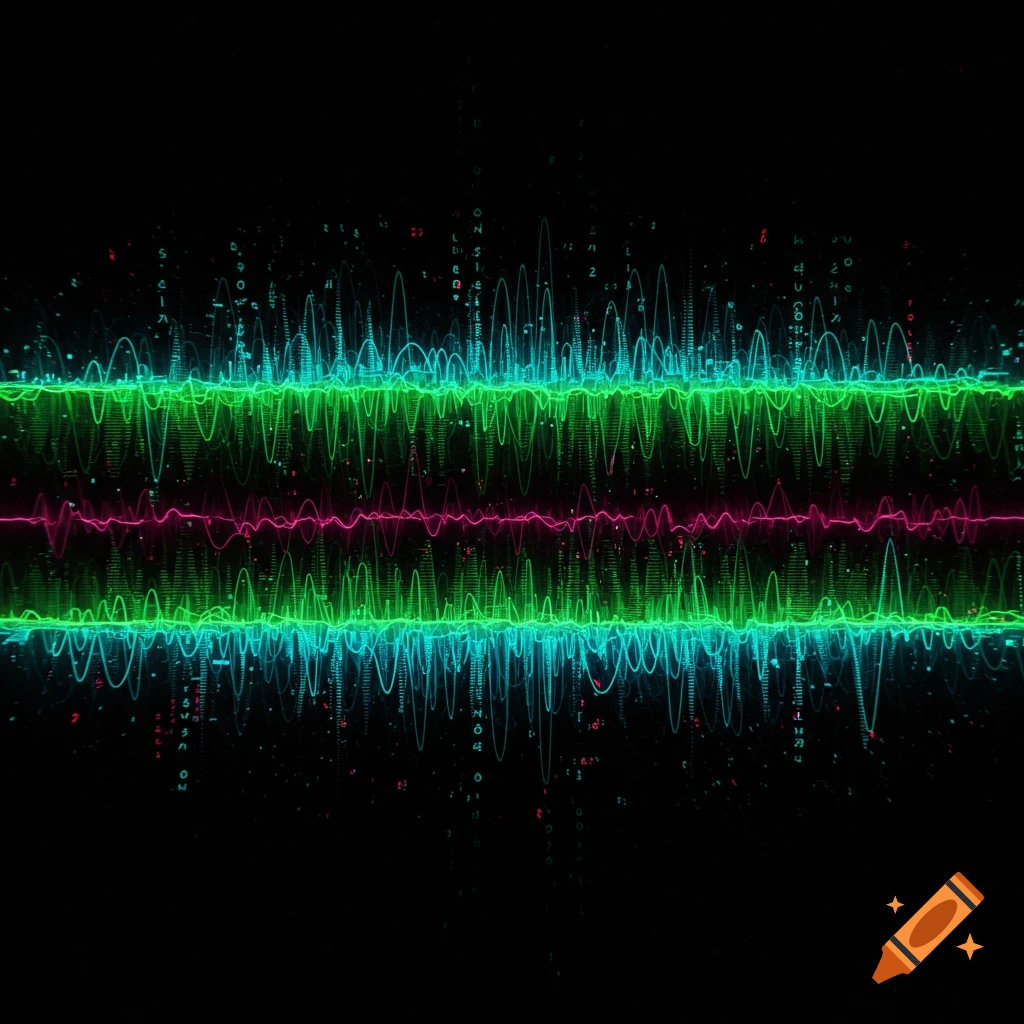
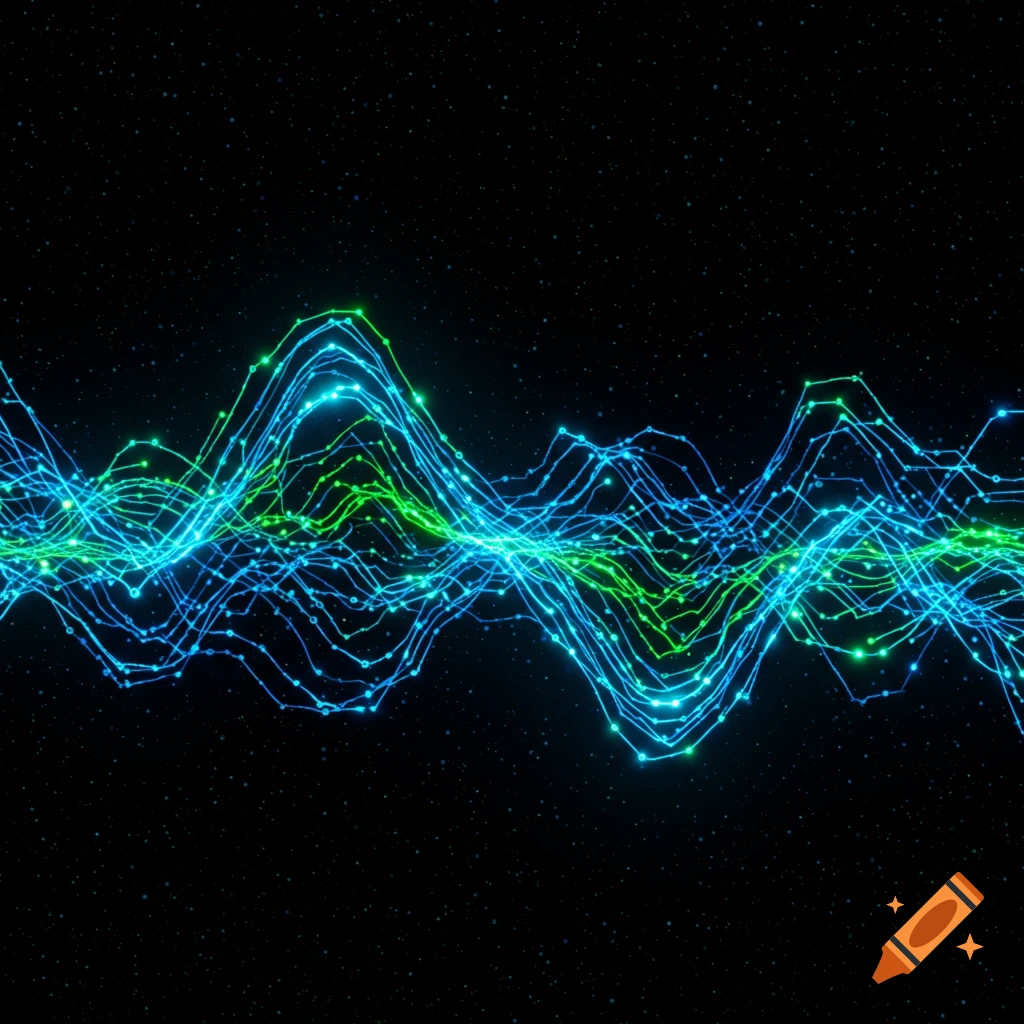
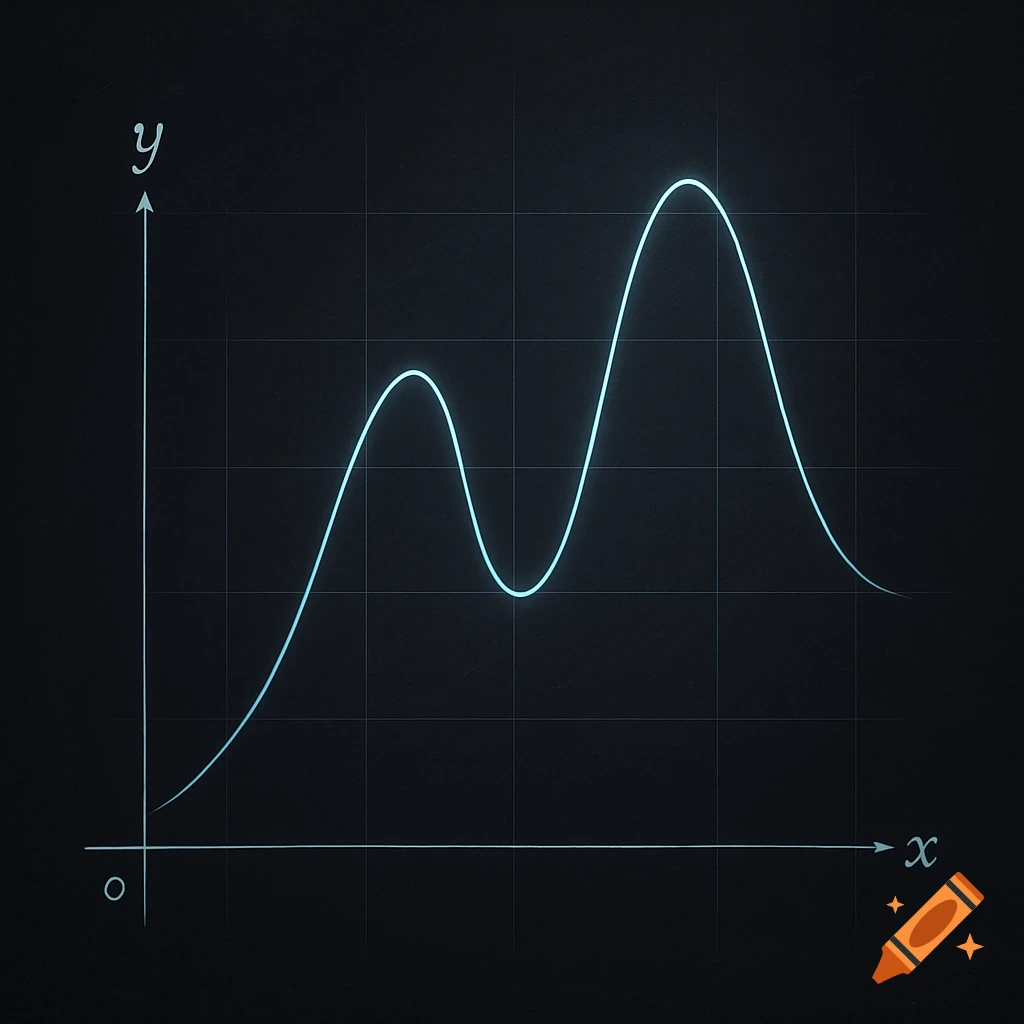
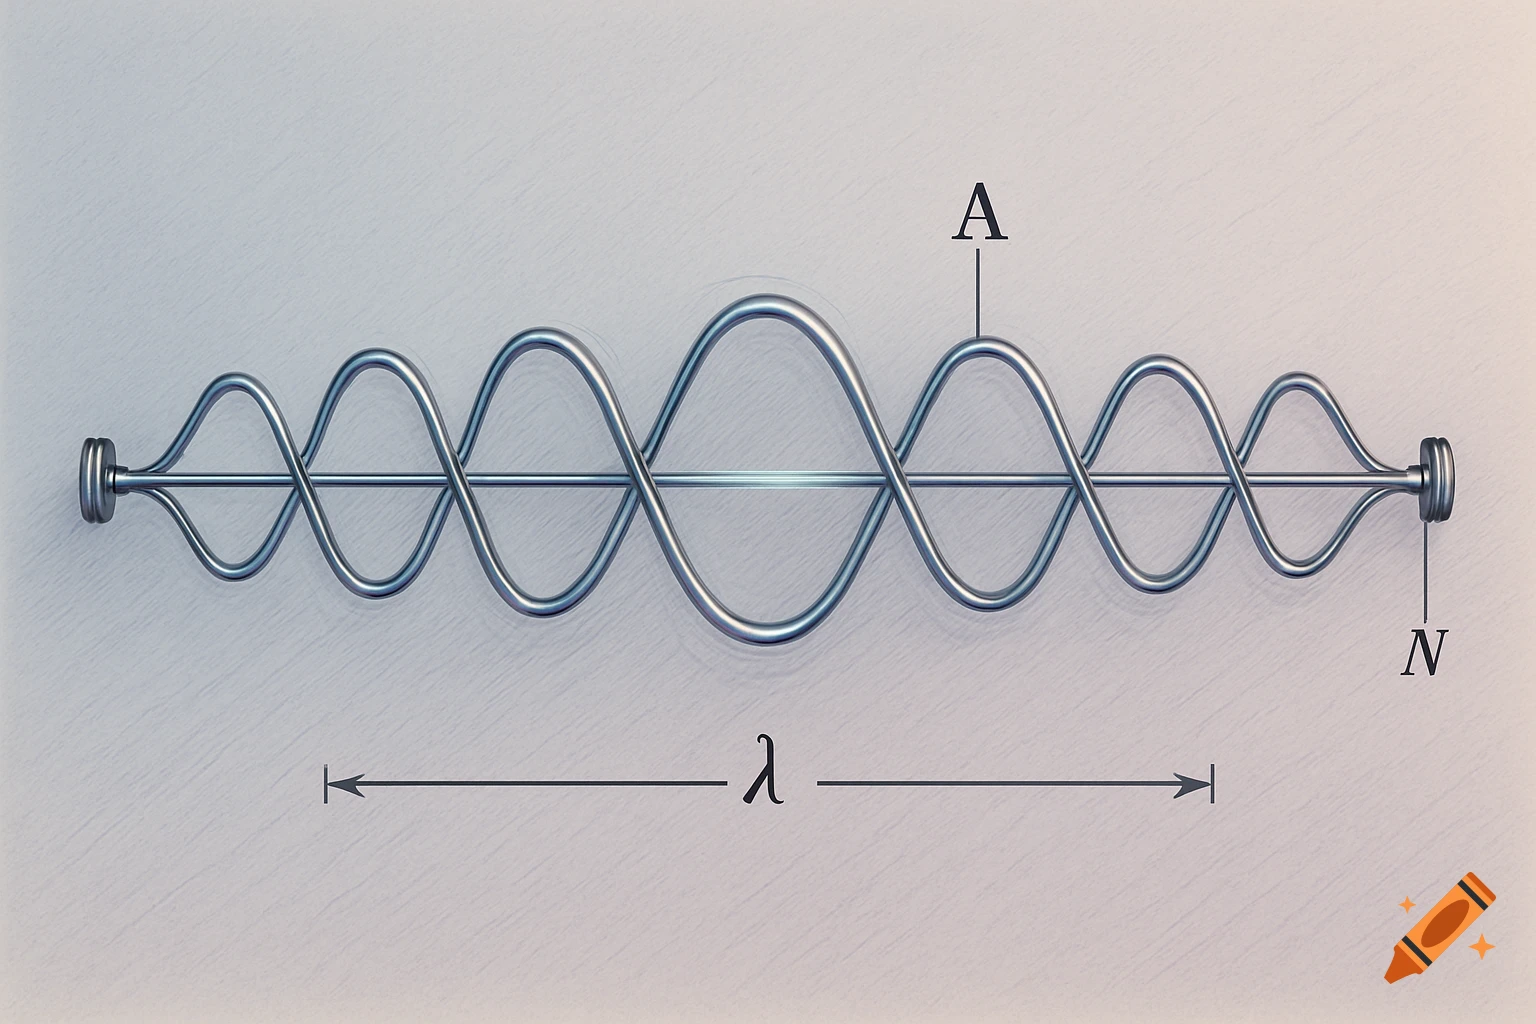
Two panels displaying time series graphs; the left shows many colorful overlapping series, and the right shows a single vibrant gradient series.

an image that represents principal component analysis for time series, with two panels only: the left one representing the many series before PCA, and the right one a single time series representing the first principal component. Series represents a lengthy sample, with many ups and downs, vivid colours Mehr sehen
More images like this