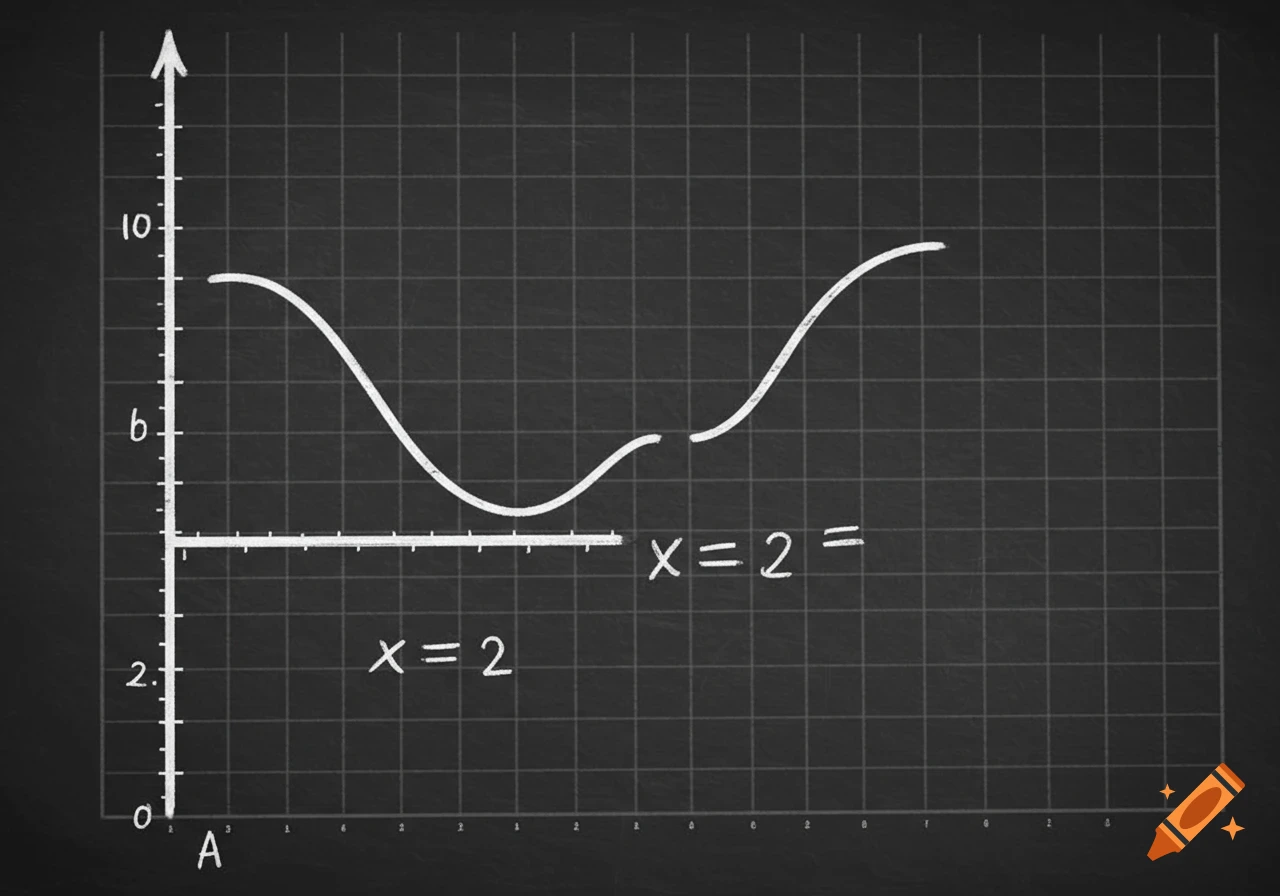
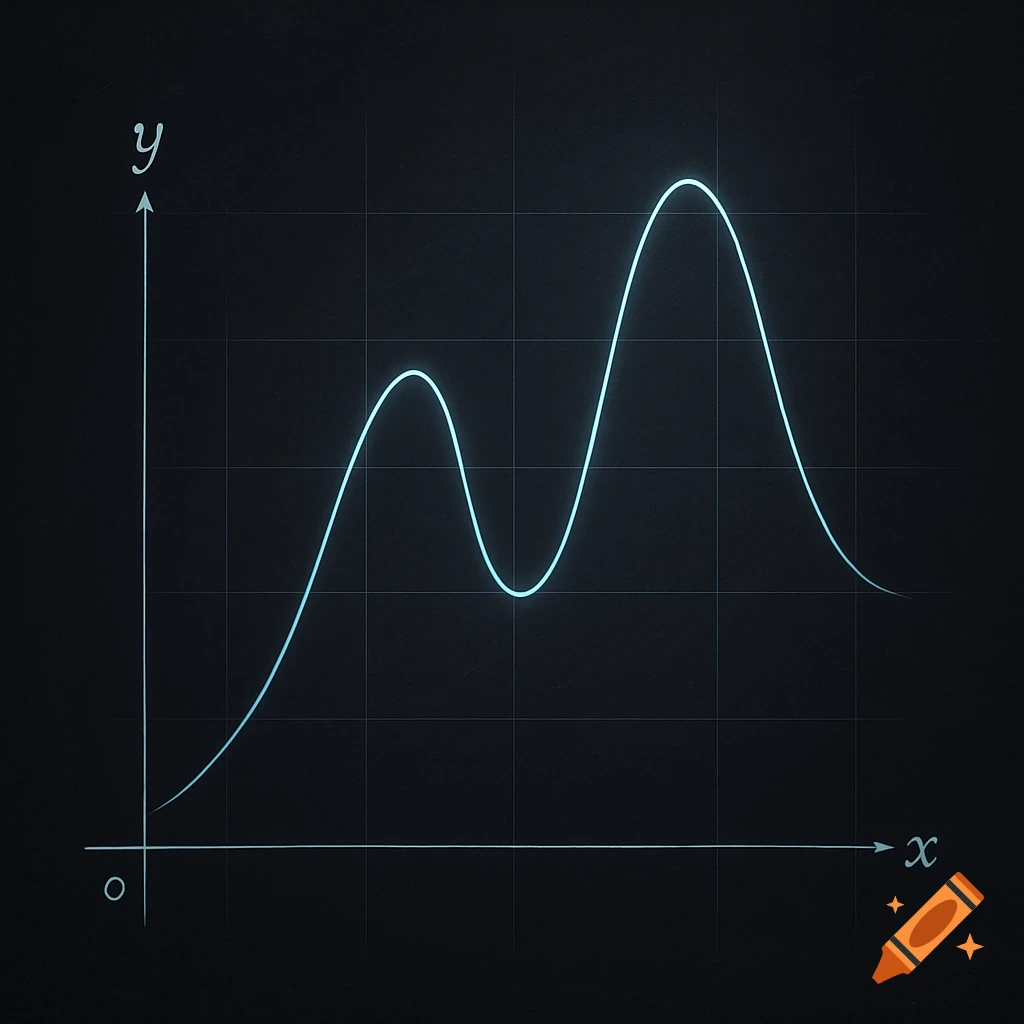
A sketch of a mathematical graph with x and y axes, showing a curve with points labeled at x=-3 and x=1, and y=-1 and y=5.
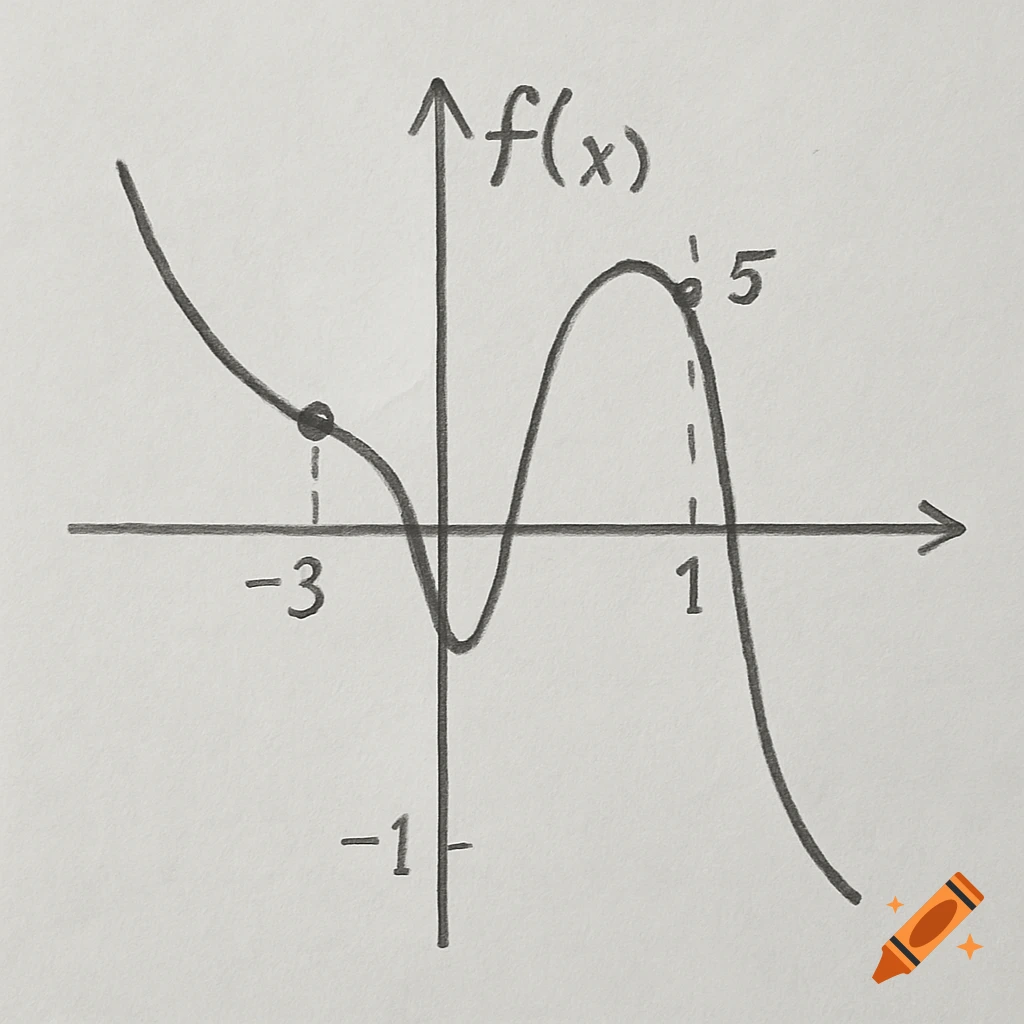
Sketch the graph of a function that satisfies the following conditions: lim x → − 3 f ( x ) = − 1 f ( − 3 ) = 1 lim x → 1 − f ( x ) = 5 lim x → 1 + f ( x ) = − 1 Mehr sehen
More images like this