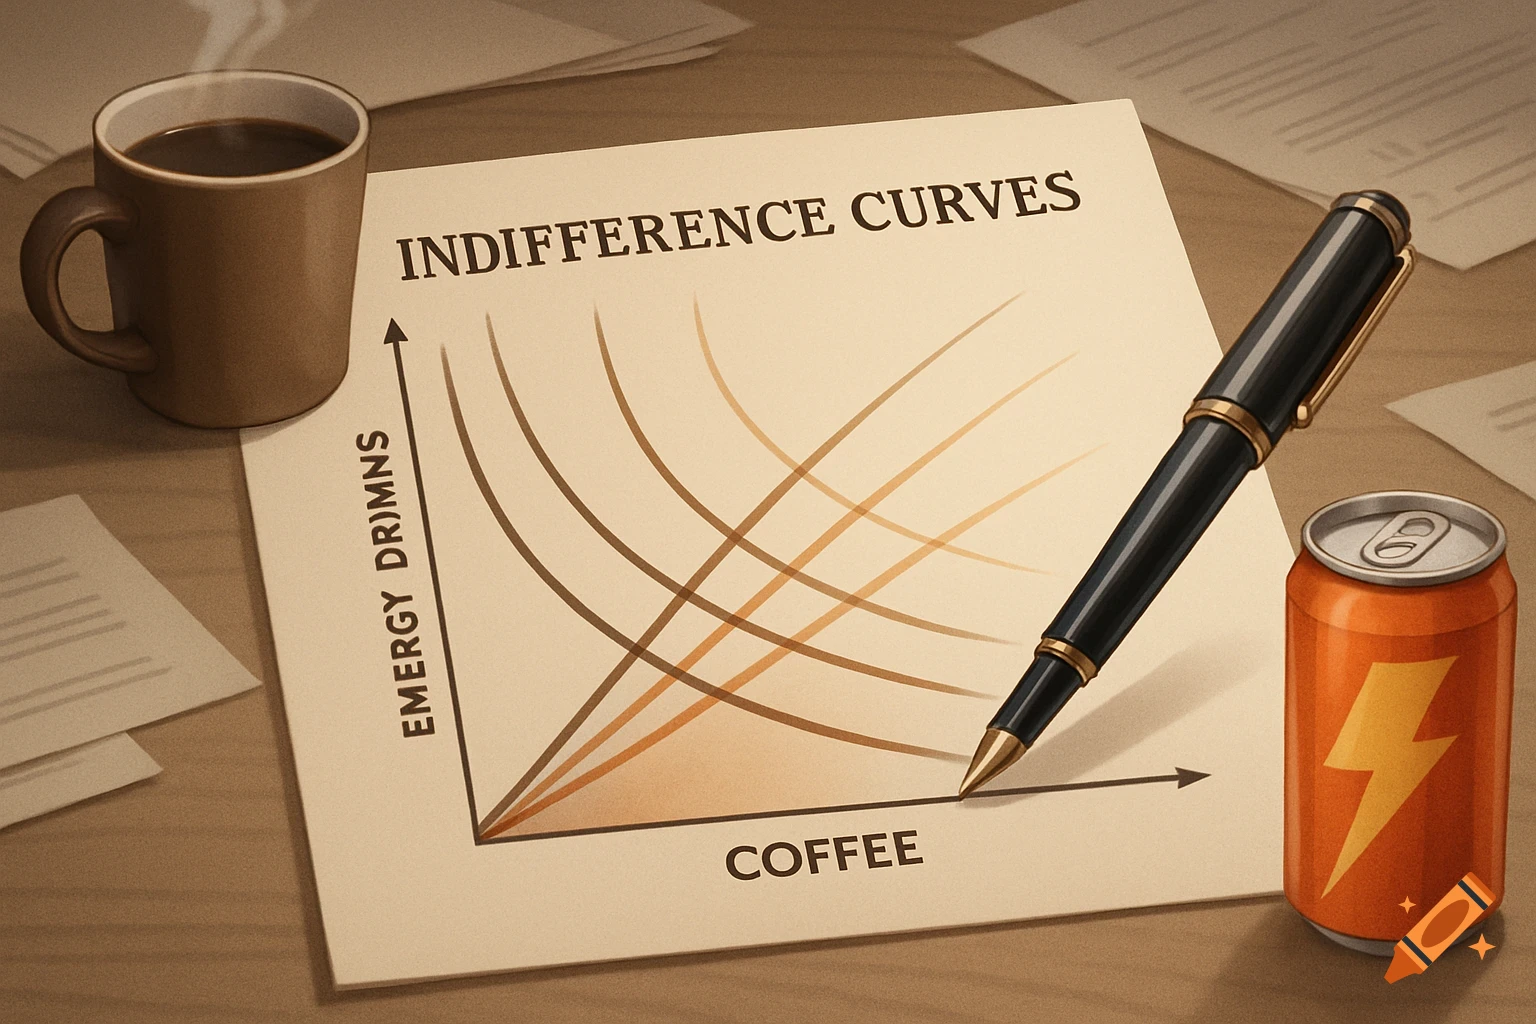
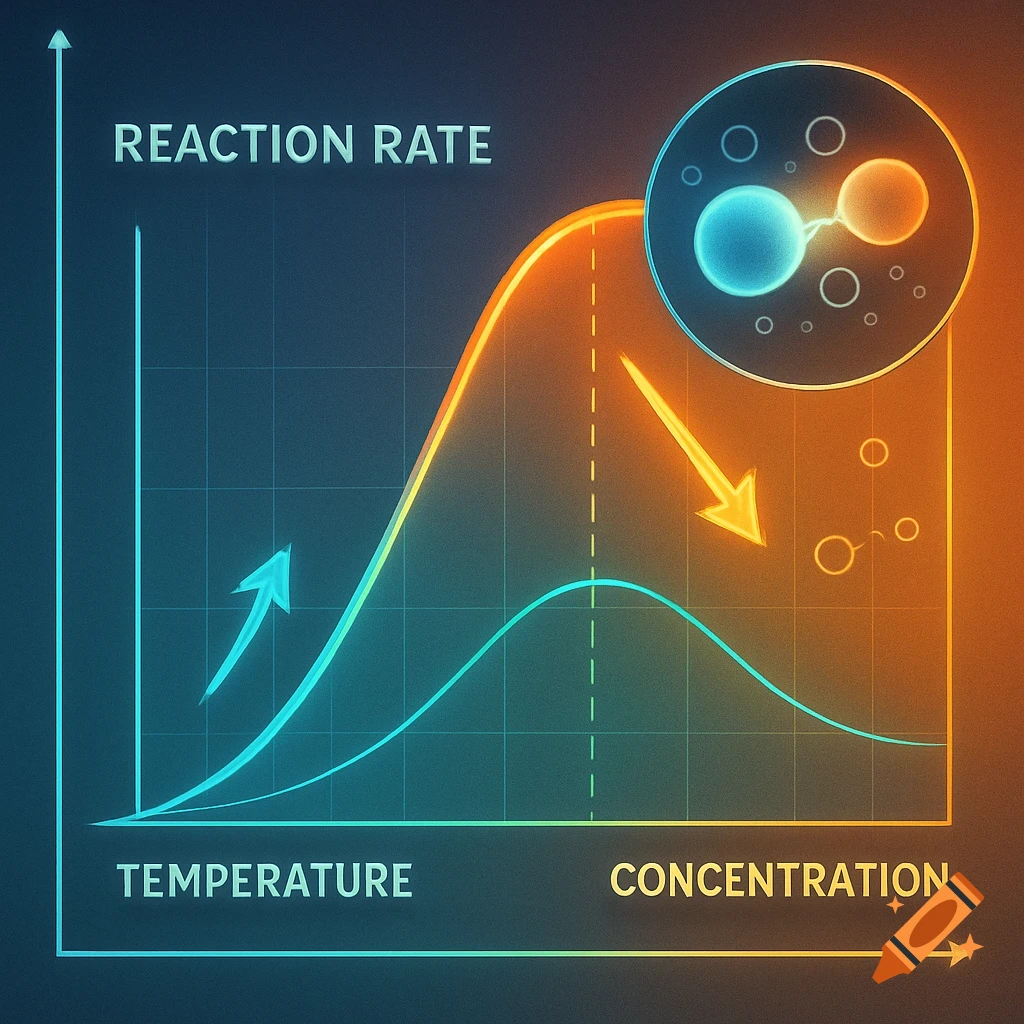
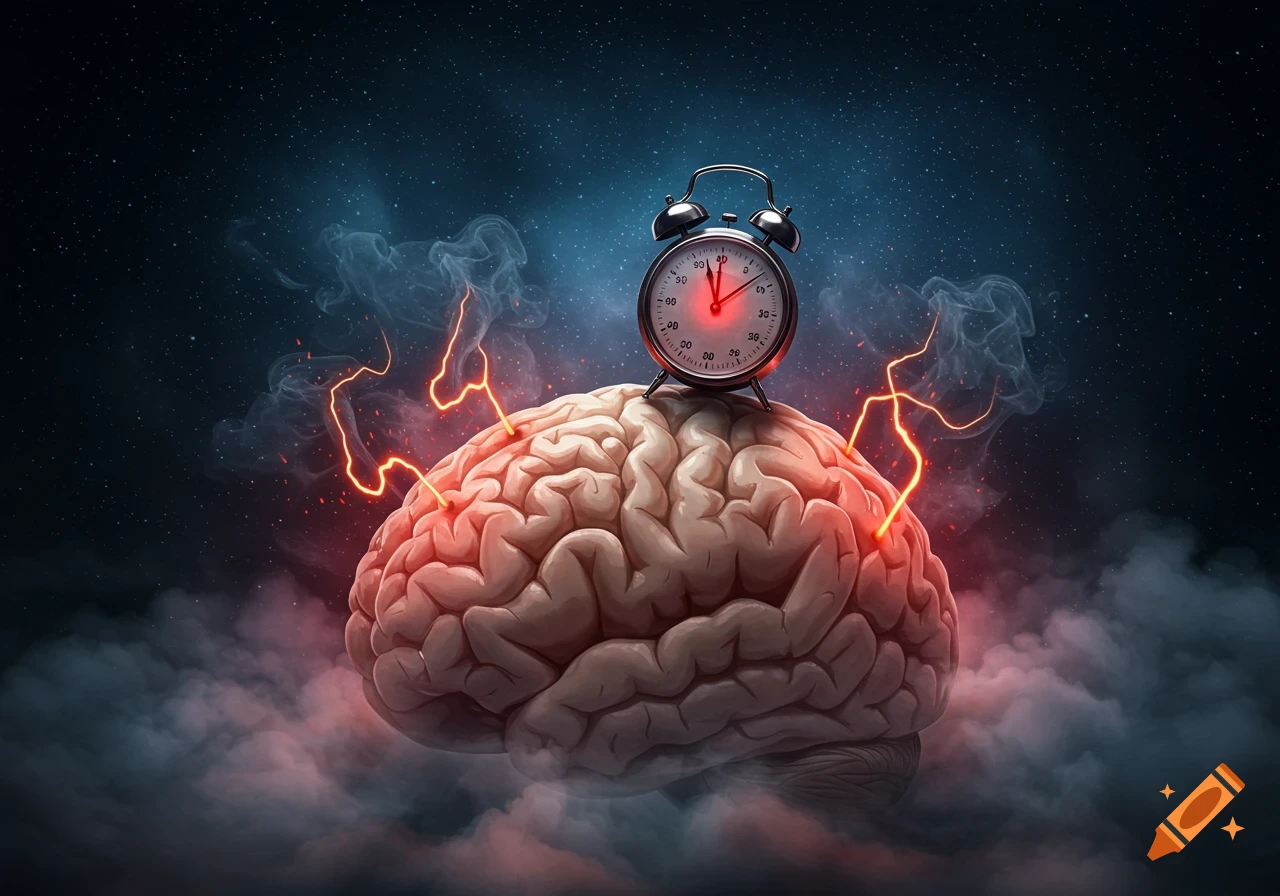
A graph illustrating the relationship between stress duration, sleep, and coffee consumption, with sleep decreasing and coffee consumption increasing.

Funny graph: two lines, the first one (sleep) goes down towards 0, second one (coffee consumption) goes to infinity. x axis: Stress duration Mehr sehen
More images like this