A graph titled 'Sleep KPI Tracking' showing hours vs days with legend for Dad, Mom, Baby.
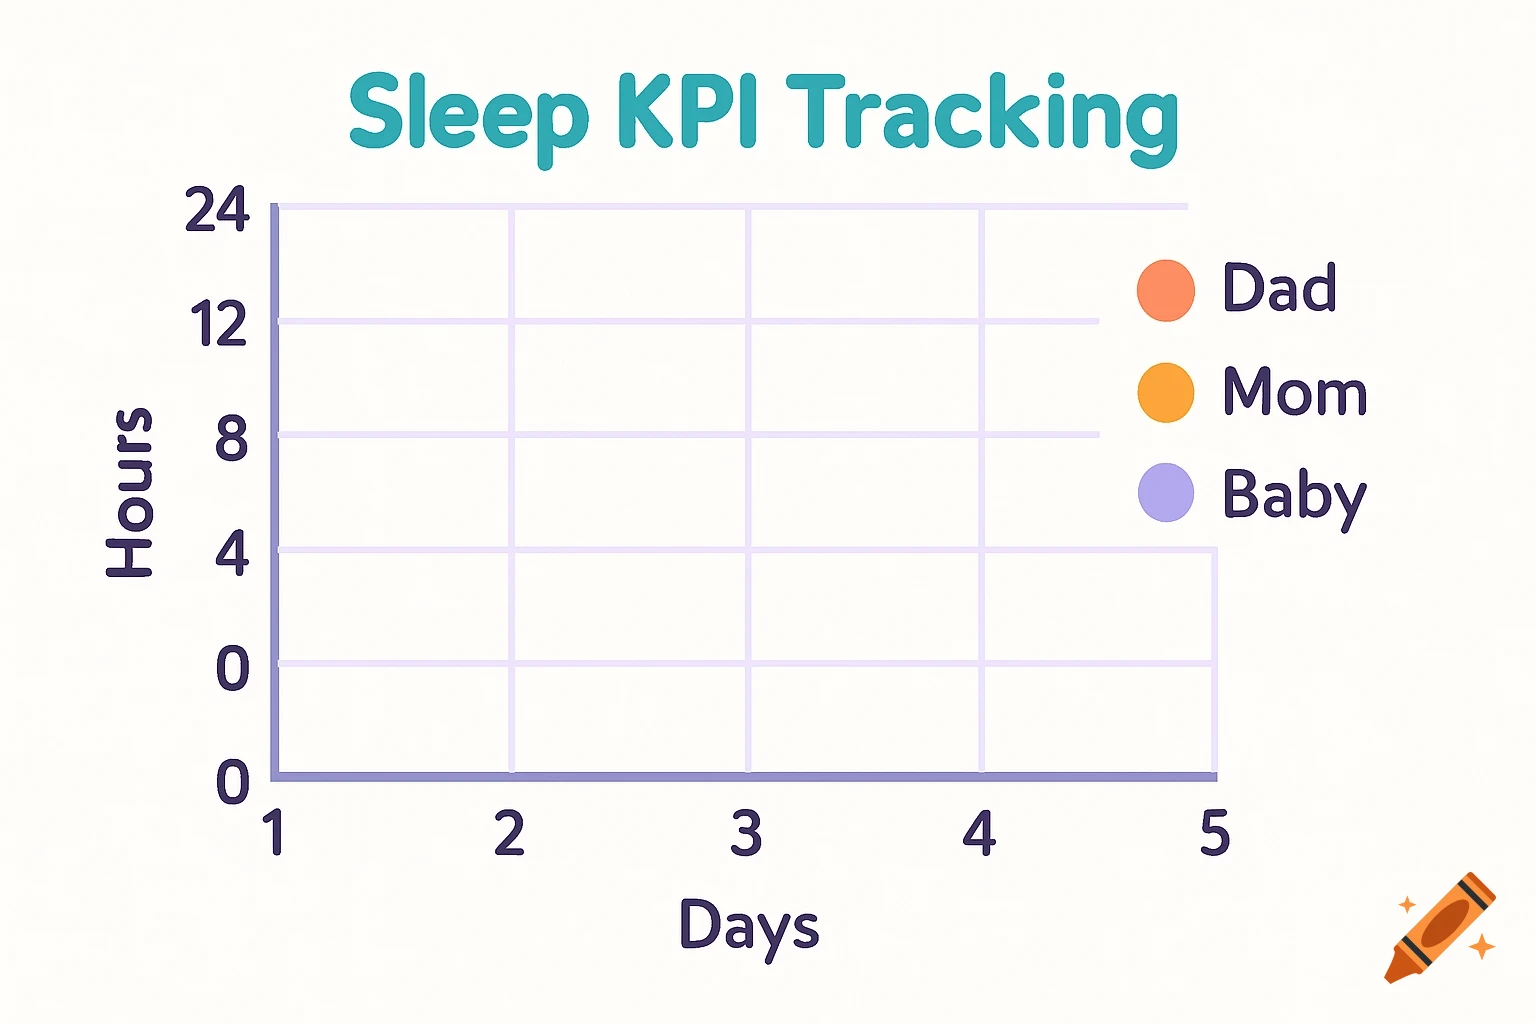
An empty graph with joyful colors that is titled: "Sleep KPI tracking". The x axis are the days (1, 2, 3, 4,5), the y axis is hours up to 24. In the legend, make sure to include color for Dad, mom, and baby Mehr sehen
More images like this