A glowing infographic chart maps Thought Intensity against Awareness, detailing states like Deep Sleep, Dream State, Awake State, Day-Dreaming, Focused Activity, Samadhi, and Realised Being.
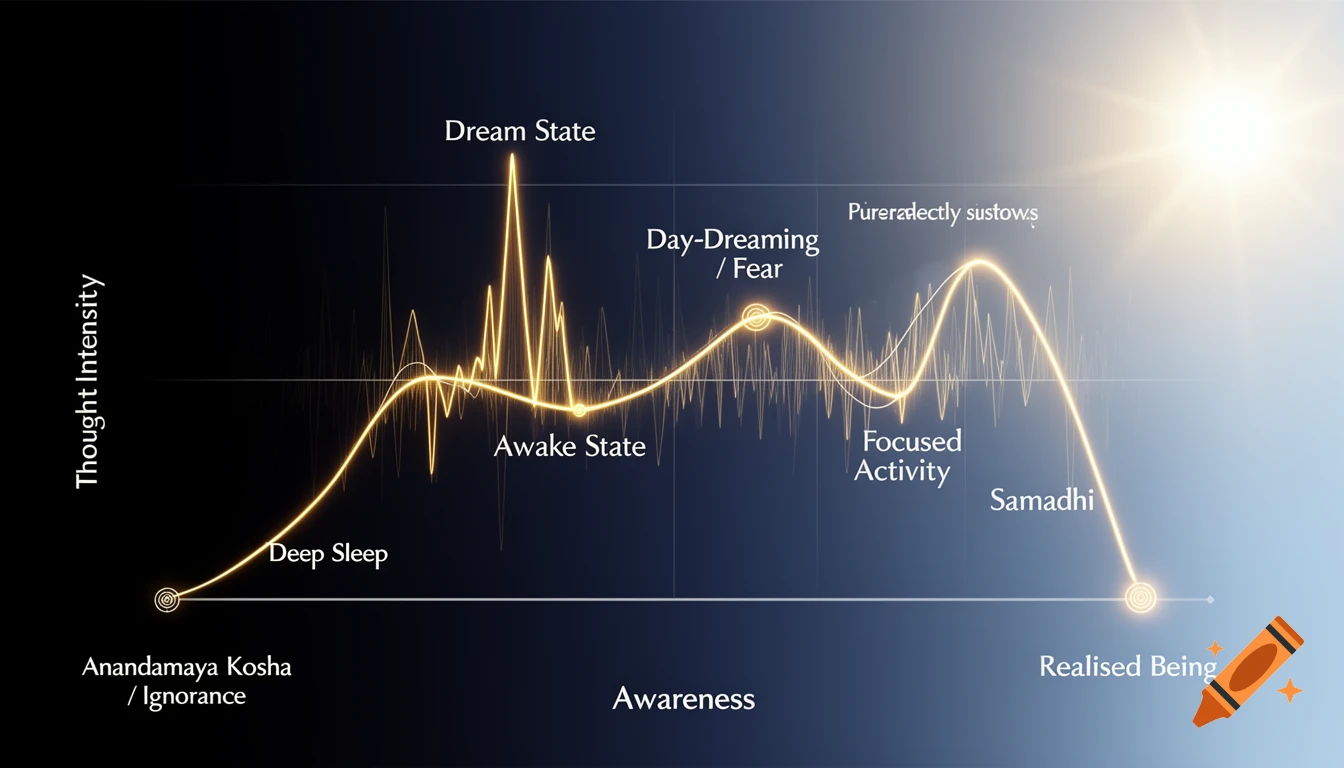
An infographic conceptual chart and spiritual diagram explaining Vedantic consciousness. The layout features a luminous, glowing data-line mapping the relationship between "Awareness" on the horizontal axis and "Thought Intensity" on the vertical axis. The background transitions horizontally: starting on the far left as a pitch-black cosmic void representing "Anandamaya Kosha / Ignorance," gradually shifting into a deep twilight, then moving into clear daylight, and ending on the far right as a brilliant, blinding midday sunshine with no shadows, representing "Pure Realisation." The glowing line maps these specific stages with small, neat text labels pointing to the nodes: 1. "Deep Sleep": Located at the bottom left in absolute darkness, thought is at zero. 2. "Dream State": A sharp, erratic neon peak high up in the twilight zone, showing high thought but low awareness. 3. "Awake State": The line drops and stabilizes in a calm, balanced daylight zone. 4. "Day-Dreaming / Fear": A chaotic, jagged spike dipping backward into darker shadows. 5. "Focused Activity": A smooth, descending curve moving right into brighter light, thought becomes laser-focused. 6. "Samadhi": The line drops near the bottom as thought recedes into a quiet whisper. 7. "Realised Being": At the absolute far-right edge, resting at the bottom of the chart in the center of the brilliant midday sun, thought is a perfectly controlled tool. The graphic style is clean, modern, sacred geometry, minimalist vector Mehr sehen
More images like this