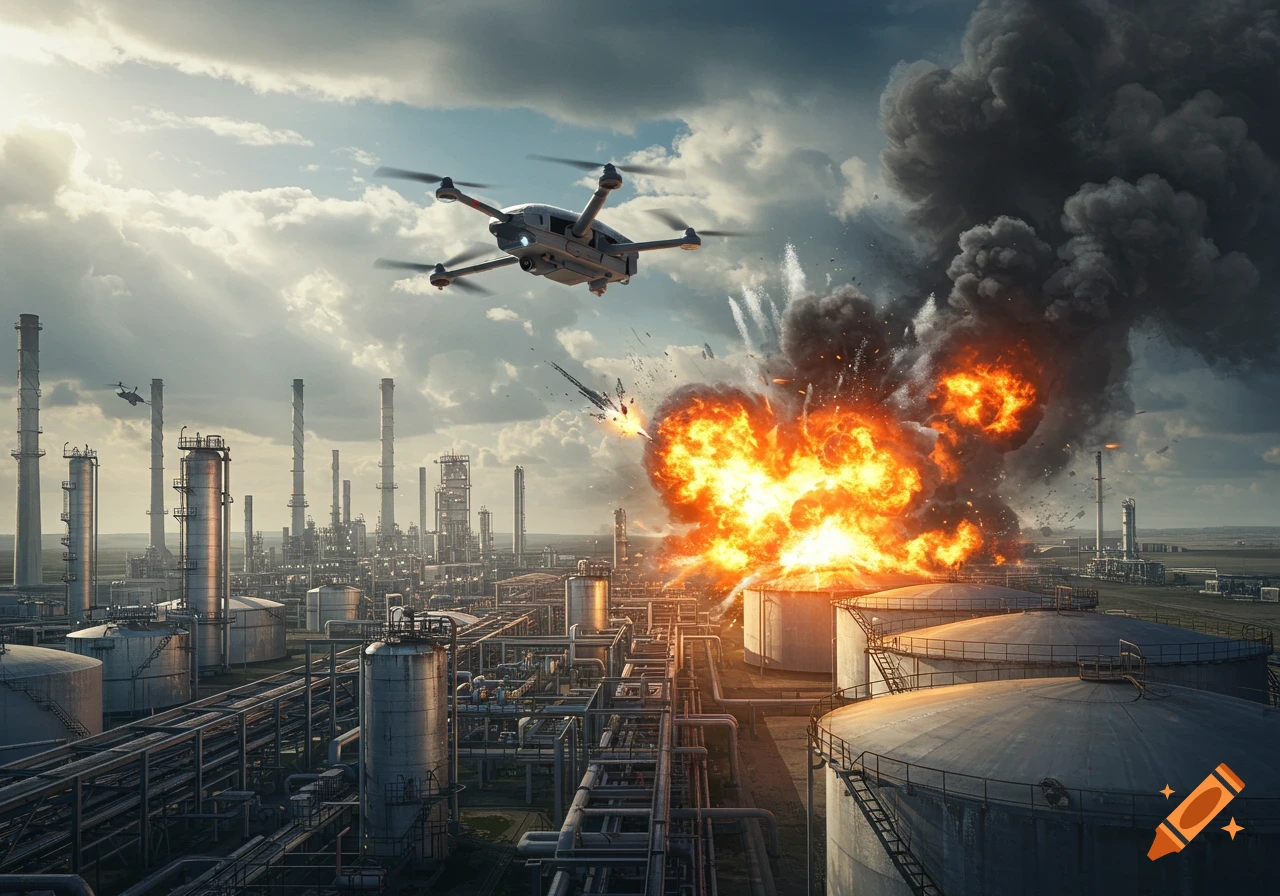
A sophisticated digital infographic titled 'Figure 6.1: Consequence Modeling Process,' detailing the impacts of 'Minor Leak' and 'Major Rupture' with visual elements of fire and smoke. It maps consequences like 'Environmental Impact,' 'Asset Loss,' 'Safety Impact,' and 'Production Interruption' to a 'Consequence Classification Matrix.' Various data points and charts show 'Risk Analysis,' 'CO2 Emissions,' 'Damage Cost,' and 'Downtime' in a futuristic blue interface.

"Figure 6.1 illustrates the step-by-step methodology adopted for consequence modeling. The process begins with the identification of release scenarios (e.g., small leak vs. full rupture) based on the pipeline's operational parameters. It then evaluates the impact on four primary receptors: safety, environment, asset loss, and production downtime. The outputs are then integrated to assign a final Consequence Category (1 to 5) as per the DNV-RP-G103 guidelines." Mehr sehen
More images like this