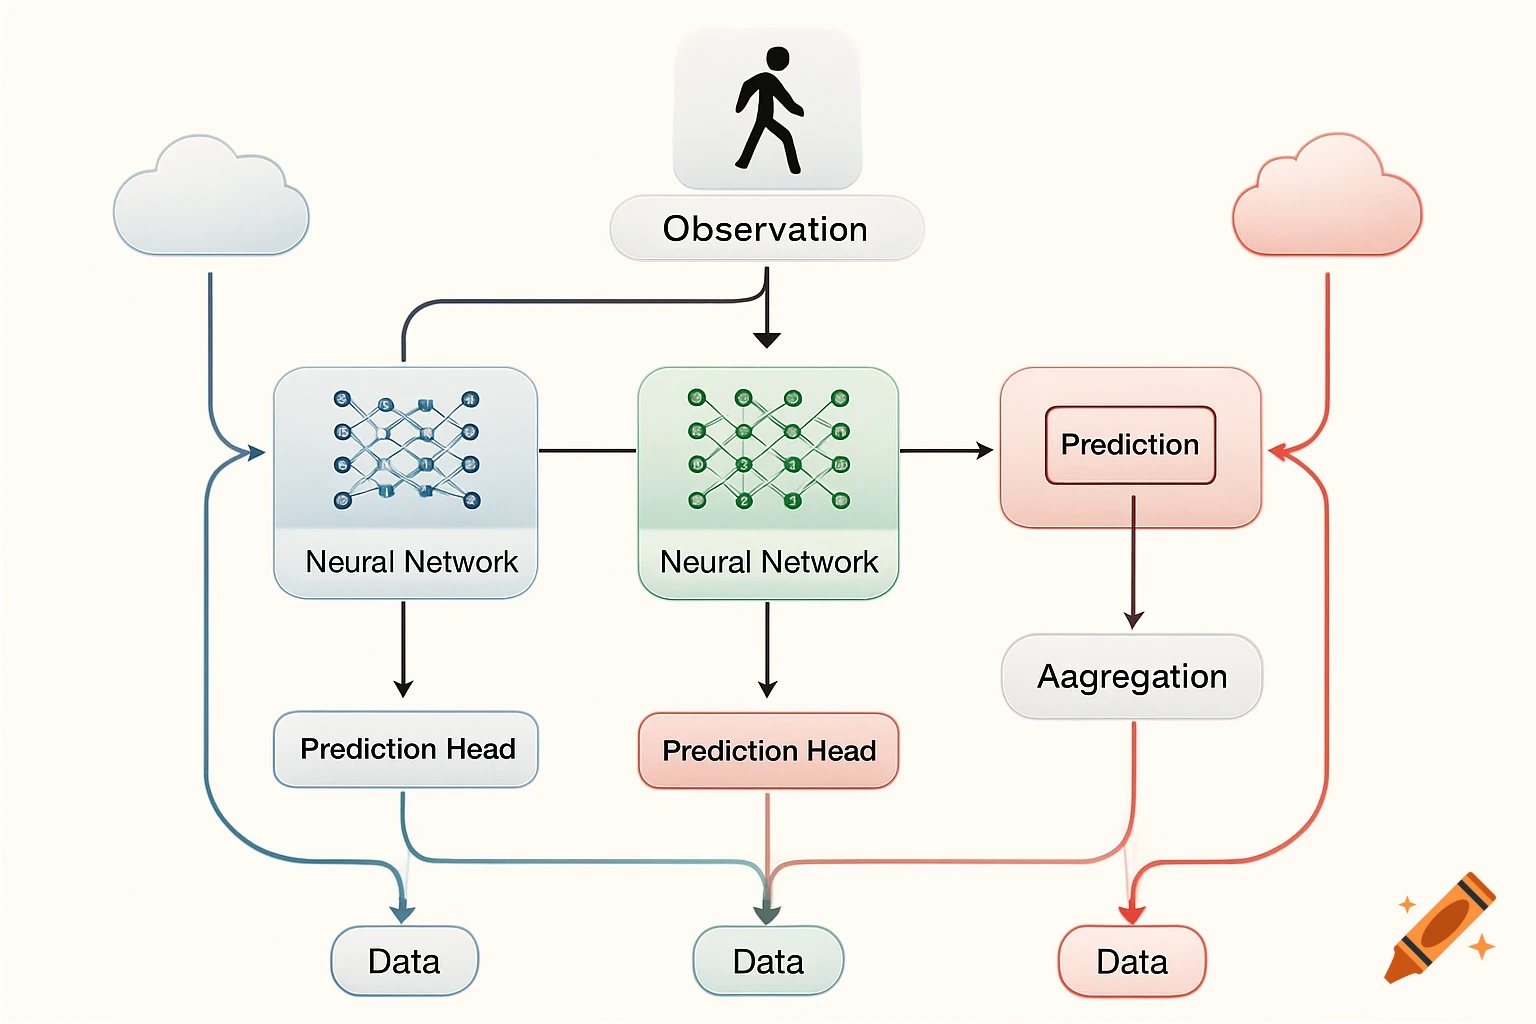
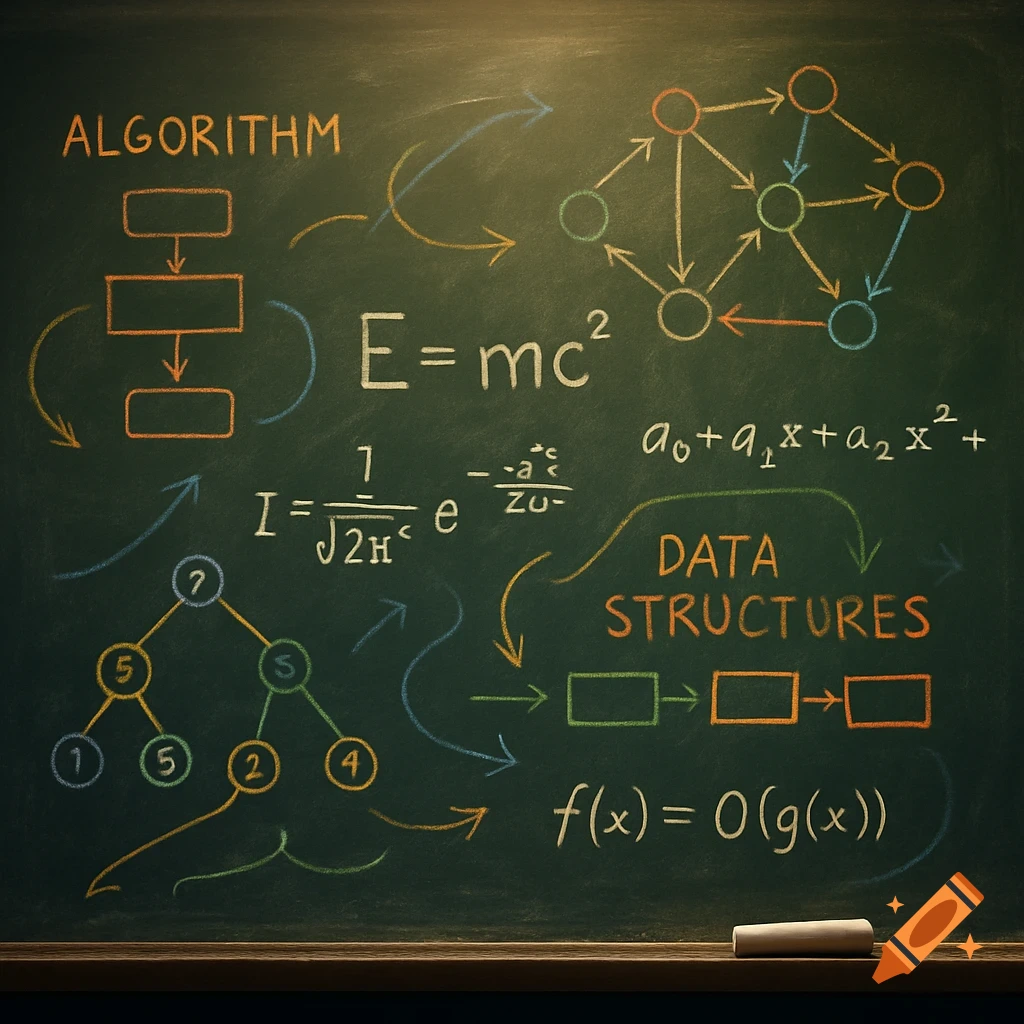
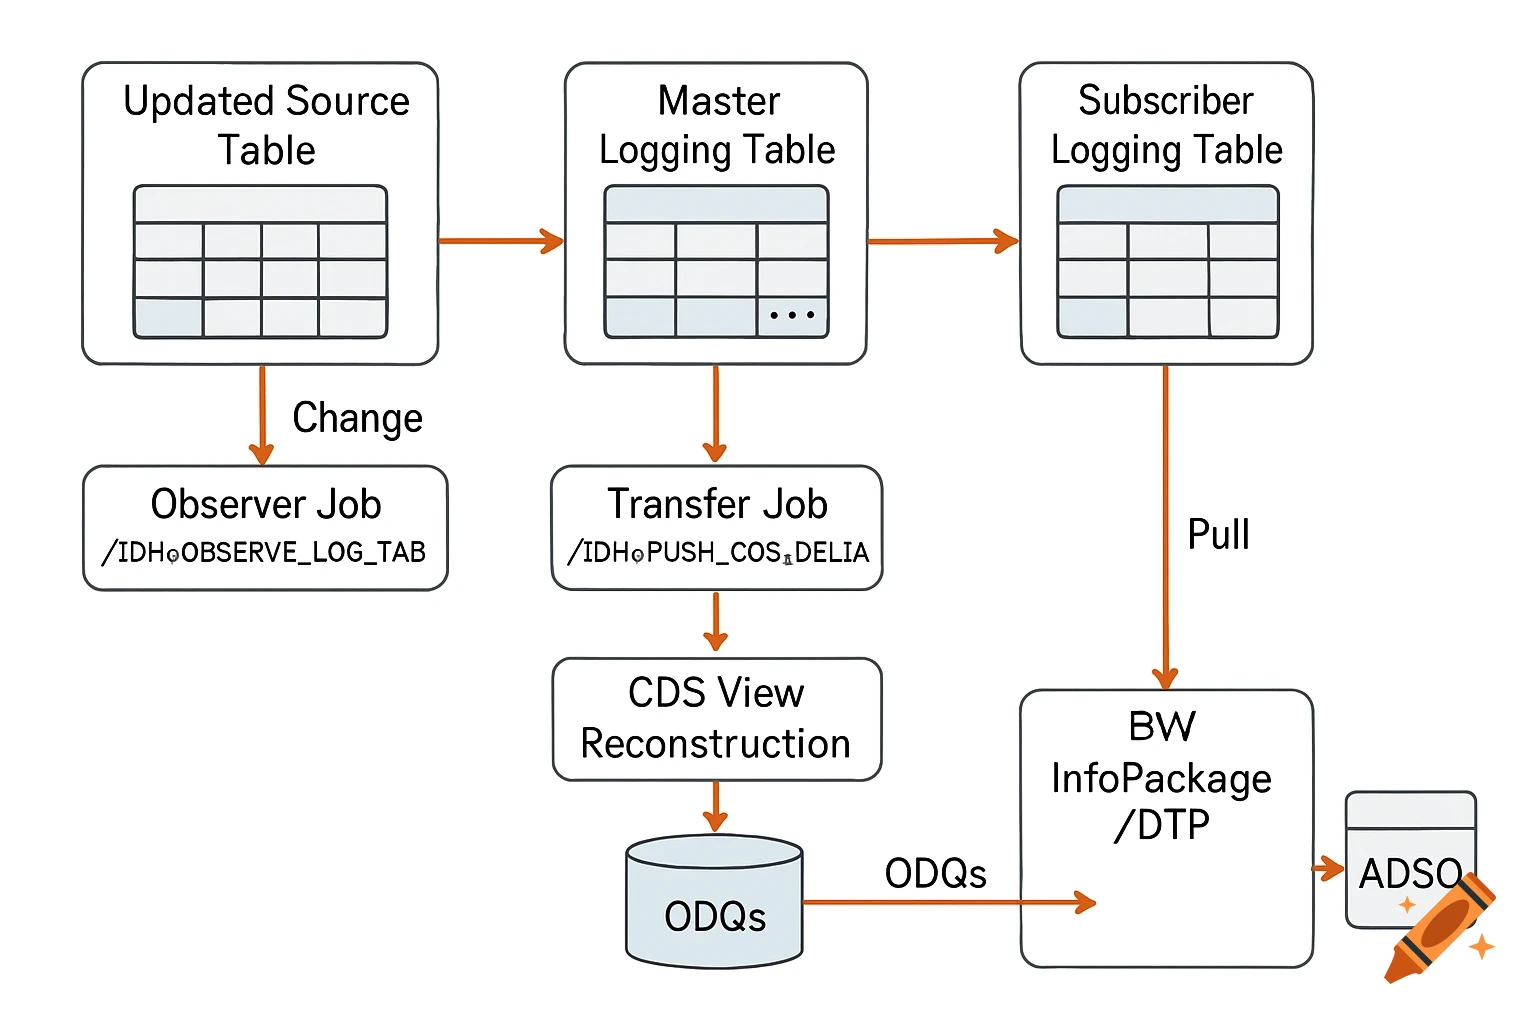
Educational infographic illustrating the Transformer and Self-Attention algorithm, showing token processing, linear projections, attention matrix, and weighted sum.

Educational infographic explaining Transformer and Self-Attention algorithm. White background, clean flat vector style, minimal text, academic but beginner-friendly. Center: large box labeled “Transformer”. Inside the box: a highlighted section labeled “Self-Attention”. Left side input: Example text tokens: [I] [love] [AI] Each token becomes a small vertical vector bar. Below them, show three colored linear projections: Blue arrows labeled “Q” Green arrows labeled “K” Orange arrows labeled “V” Show Q from one token comparing with K from all tokens. Draw thin connecting lines forming a small attention matrix grid. Next to it, a tiny softmax curve icon (very small, subtle). Then show weighted sum: Attention weights × V vectors → combined output vector. Output vectors exit Transformer on the right side. On the far left also show: - image split into square patches - audio waveform split into segments Both converted into similar vector sequences (to show modality independence) Very little text: “Q · K” “softmax” “weighted sum” Clean arrows, color-coded flows. Lots of white space. No heavy equations. Modern academic infographic style. 16:9 ratio. Mehr sehen
More images like this