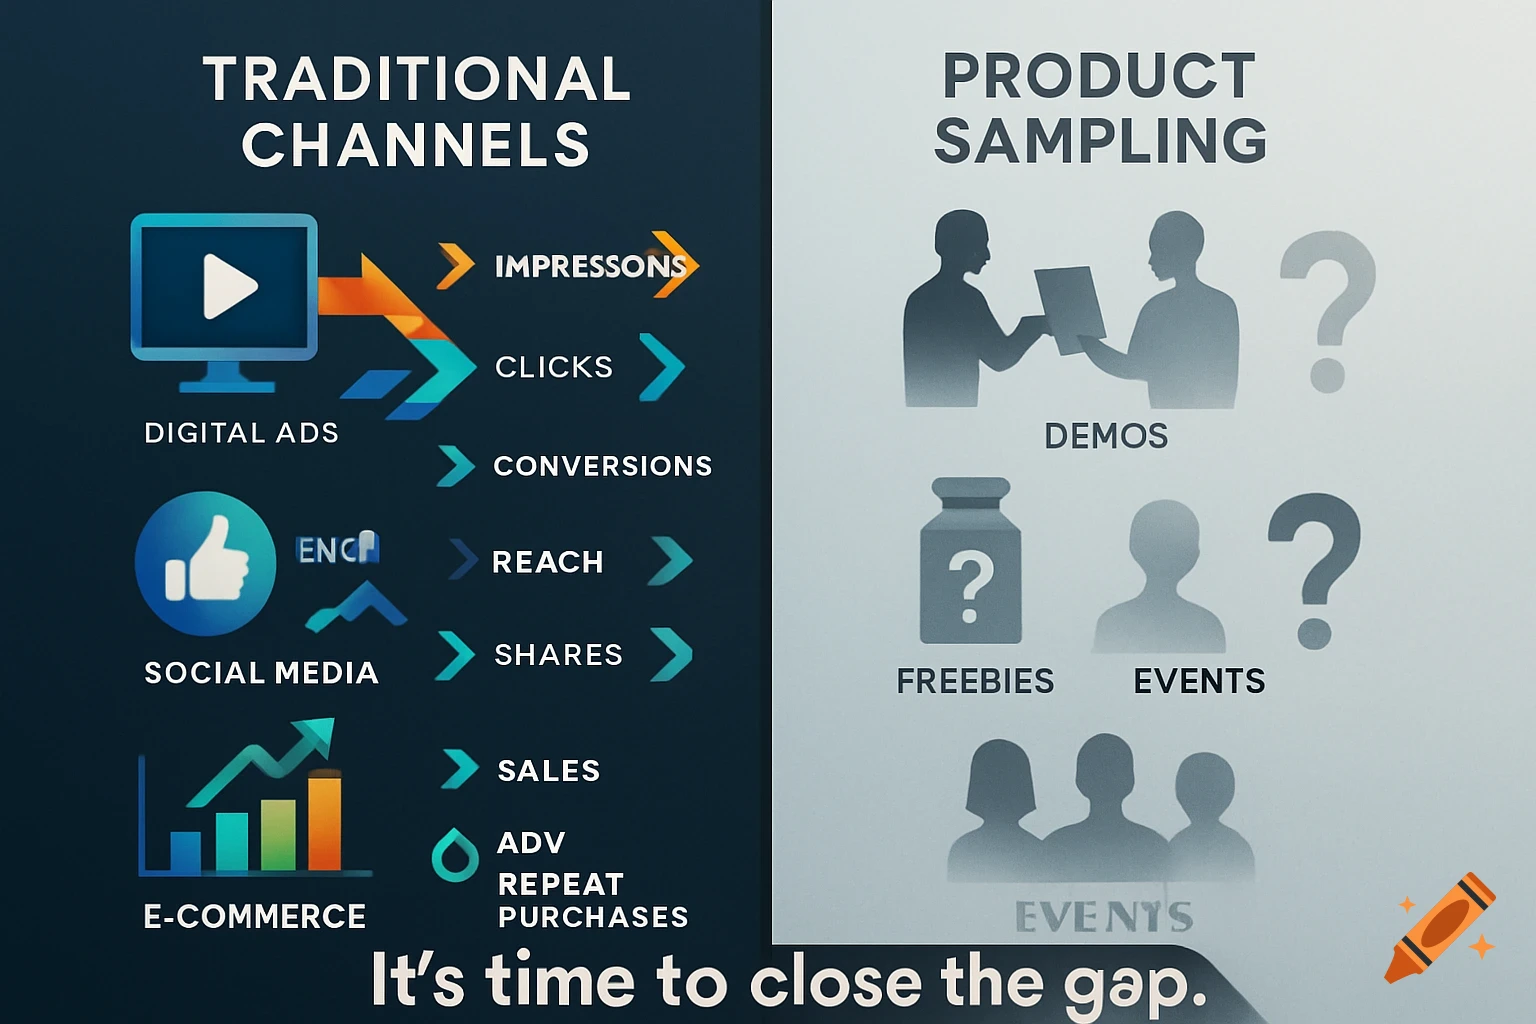
Infographic showing the relationship between marketing and strategy in finance, leading to sustainable growth.

Create a clean, professional infographic that visually explains the relationship between Marketing and Strategy in Finance, based on the following text. The infographic must have a clear central split or flow: LEFT SIDE / TOP BLOCK: MARKETING IN FINANCE - Show three interconnected icons: a magnifying glass over a customer (client needs), a pie chart or segmented circles (market segmentation by income, goals, risk tolerance), and a gift box or handshake (personalized products: loans, investment plans, insurance). - Add arrows from segmentation to personalized products. - Include a small "warning" icon: wasted resources if no segmentation. RIGHT SIDE / BOTTOM BLOCK: STRATEGY IN FINANCE - Show a compass or a road with a flag (long-term direction). - Three pillars: market positioning, product development, competitive advantage. - Visual cues for differentiation: price tag (better pricing), star (service quality), lightbulb (innovative solutions). CENTER / CONNECTION: Marketing provides data (show a database or chart flowing into Strategy). Strategy uses that data (show a gear or brain). Example: a rising digital banking graph turning into an investment in online services (laptop with bank). BOTTOM / RISK SECTION: Show a seesaw or a yellow/red warning triangle. Label visually: "Poor marketing → low demand", "Weak strategy → reduced trust". Final outcome: a green upward arrow labeled "sustainable growth" with a checkmark. Style: minimal flat infographic, corporate colors (blue, Mehr sehen
More images like this