Sketch of a skewed probability distribution curve with labeled axes and shaded area.
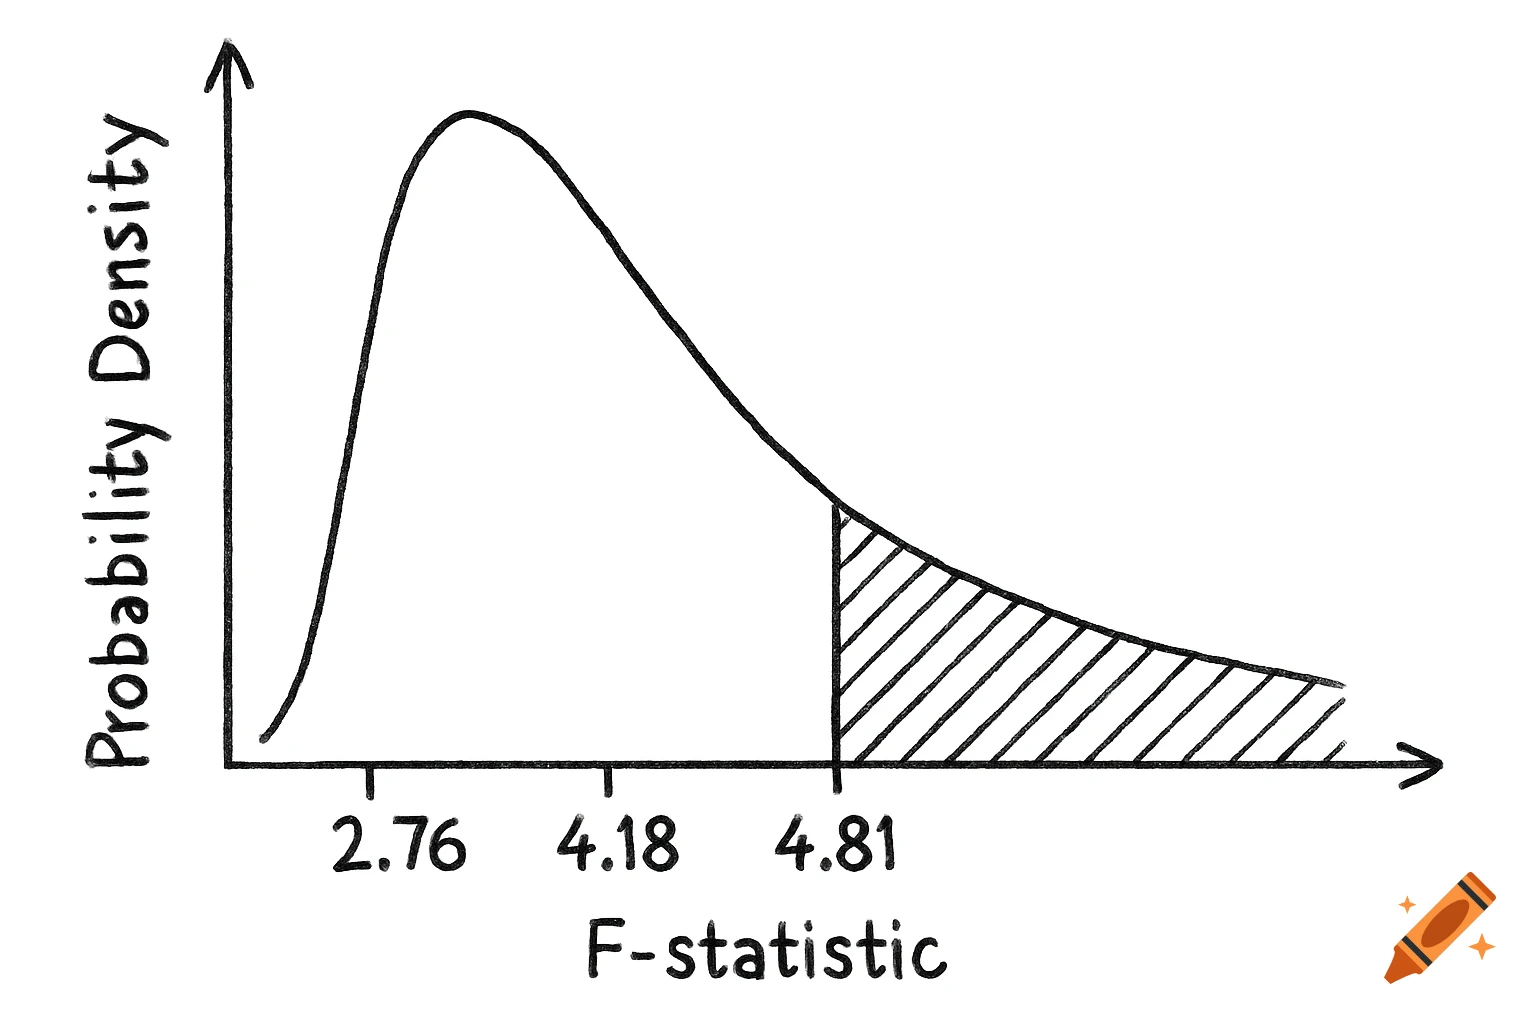
Create a simple sketch of a probability distribution curve that is skewed to the right. Label the horizontal axis 'F-statistic' starting from 0. Mark and label the following points on the horizontal axis: '2.76', '4.18', and '6.49'. Also, mark and label '4.81' on the same axis. Shade the area under the curve to the right of '4.81'. Label the vertical axis 'Probability Density'." Mehr sehen
More images like this