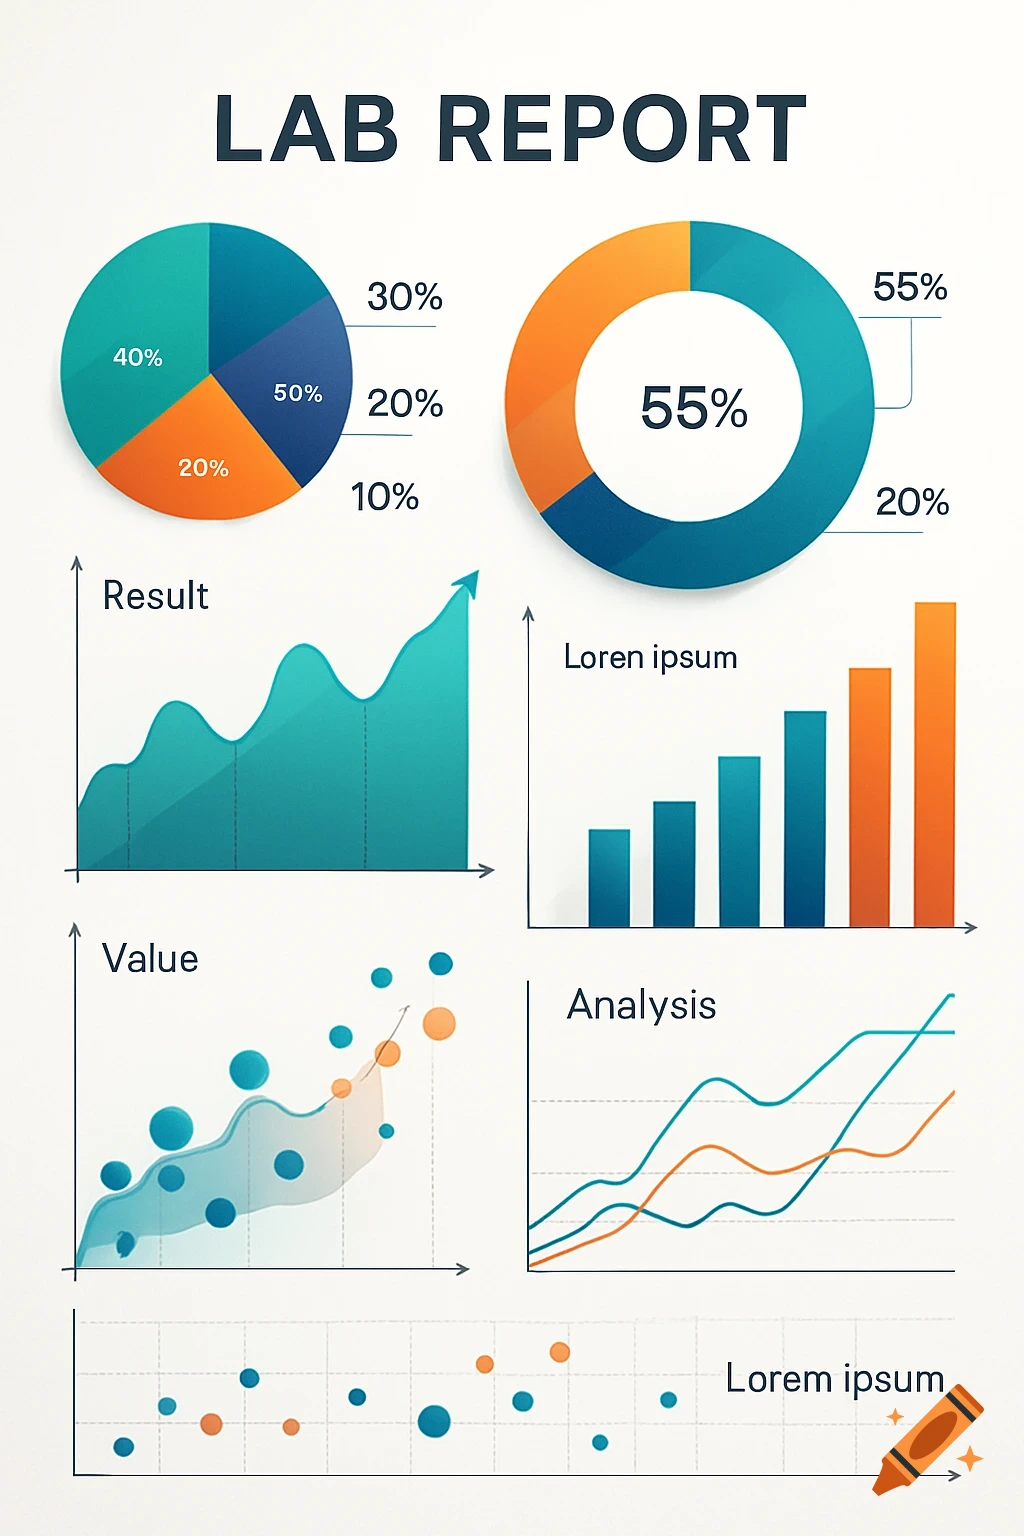
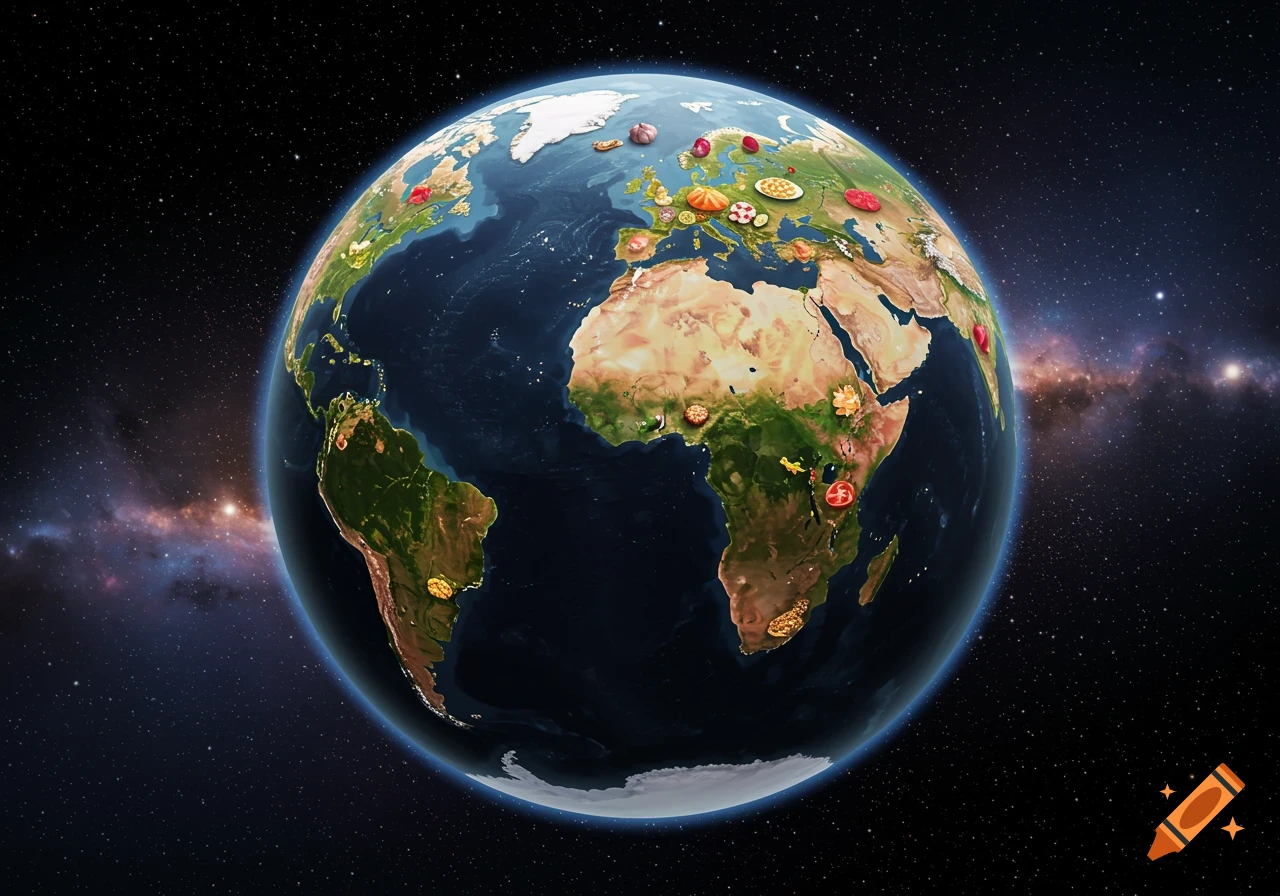
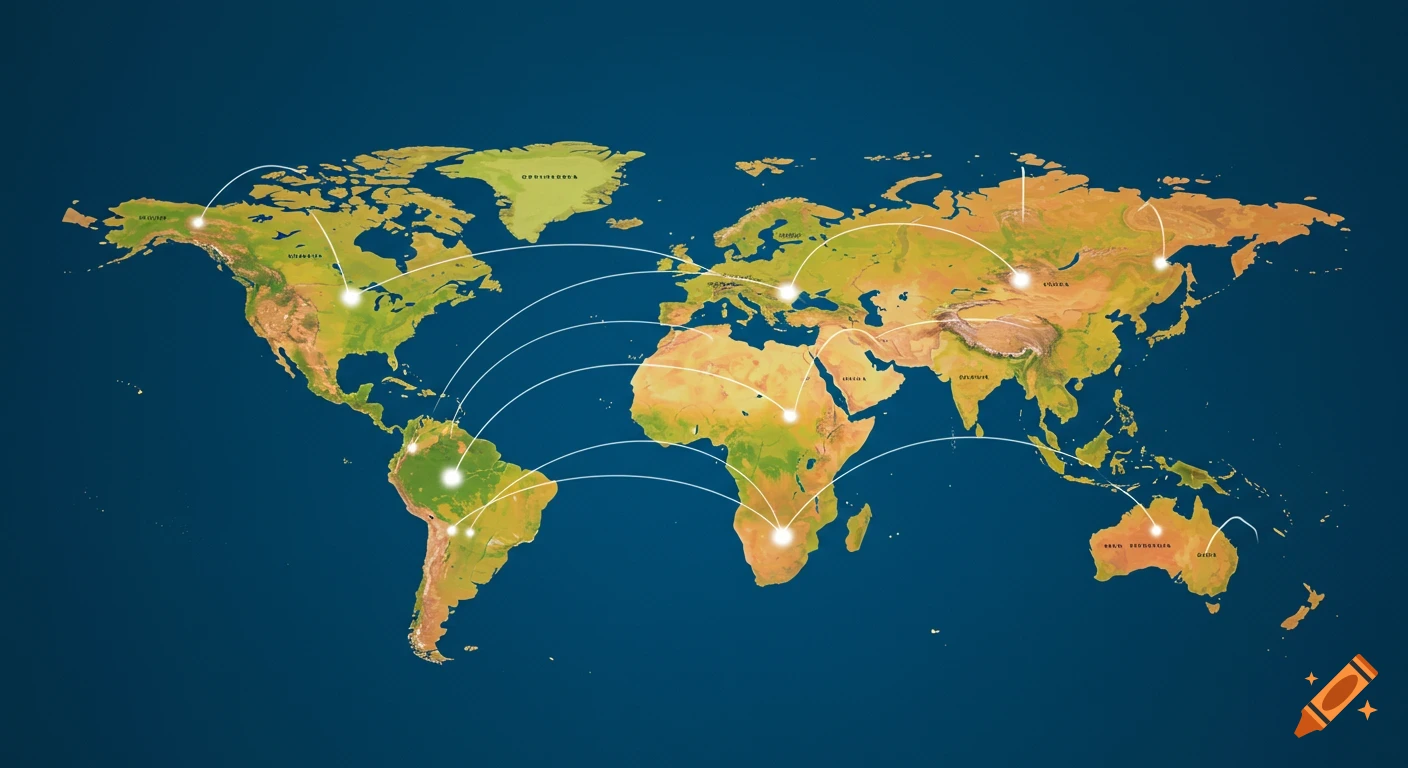
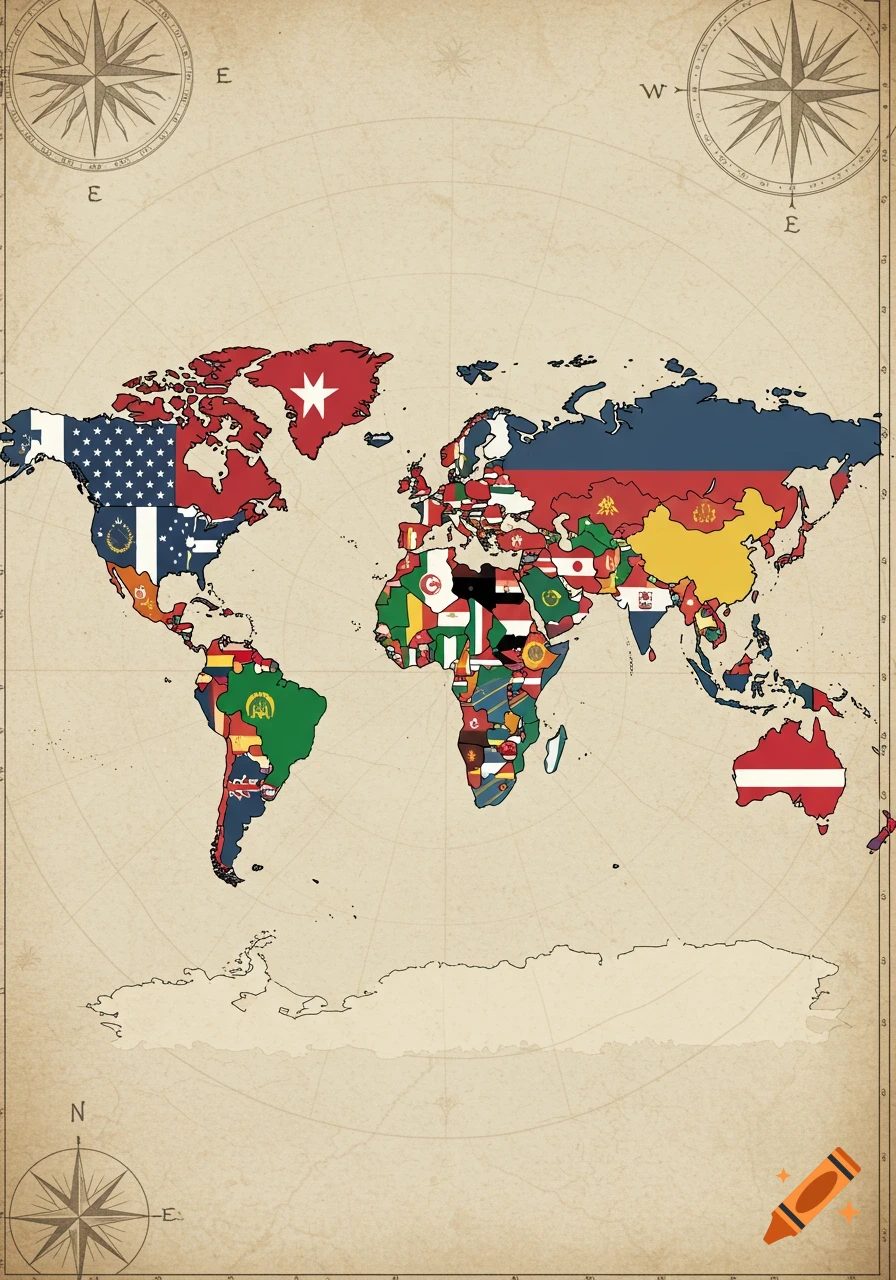
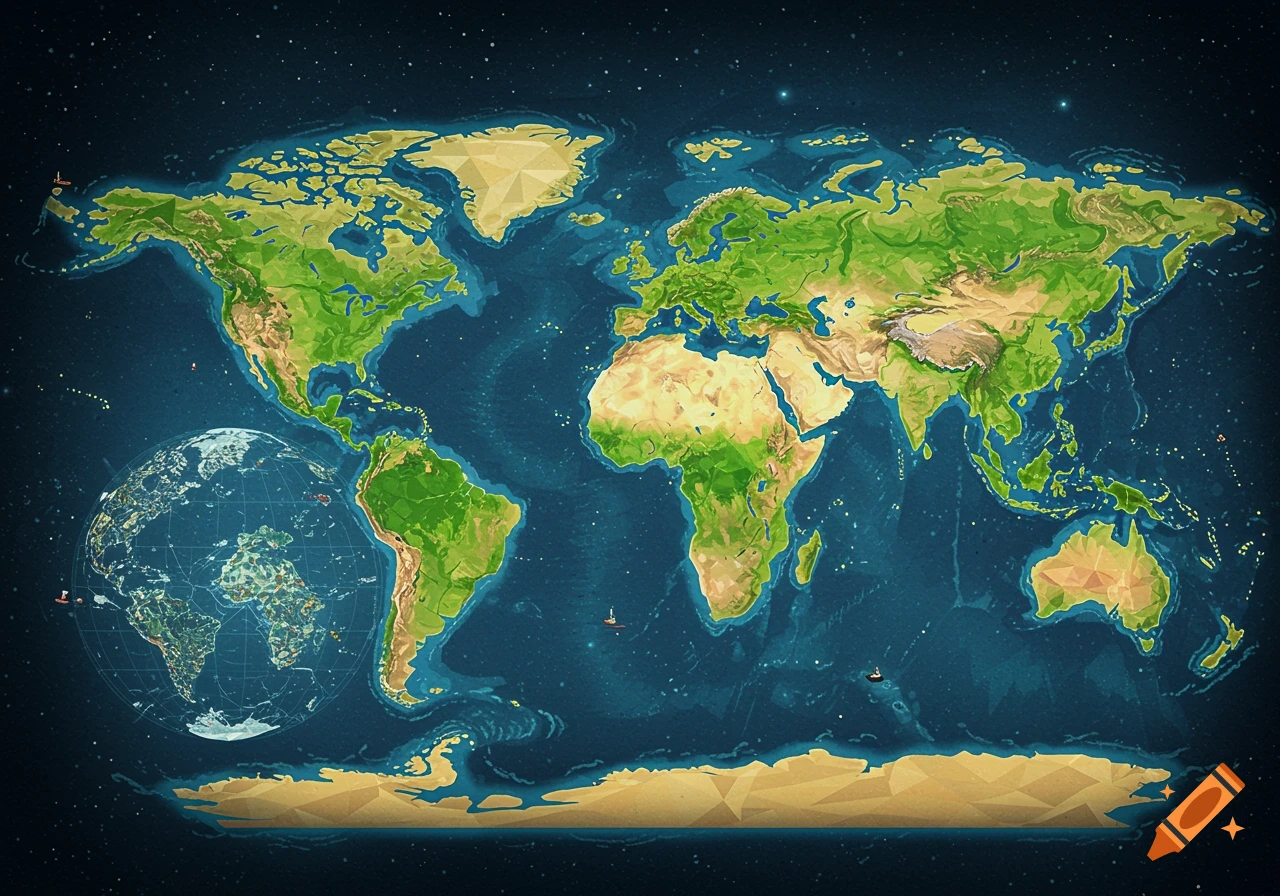
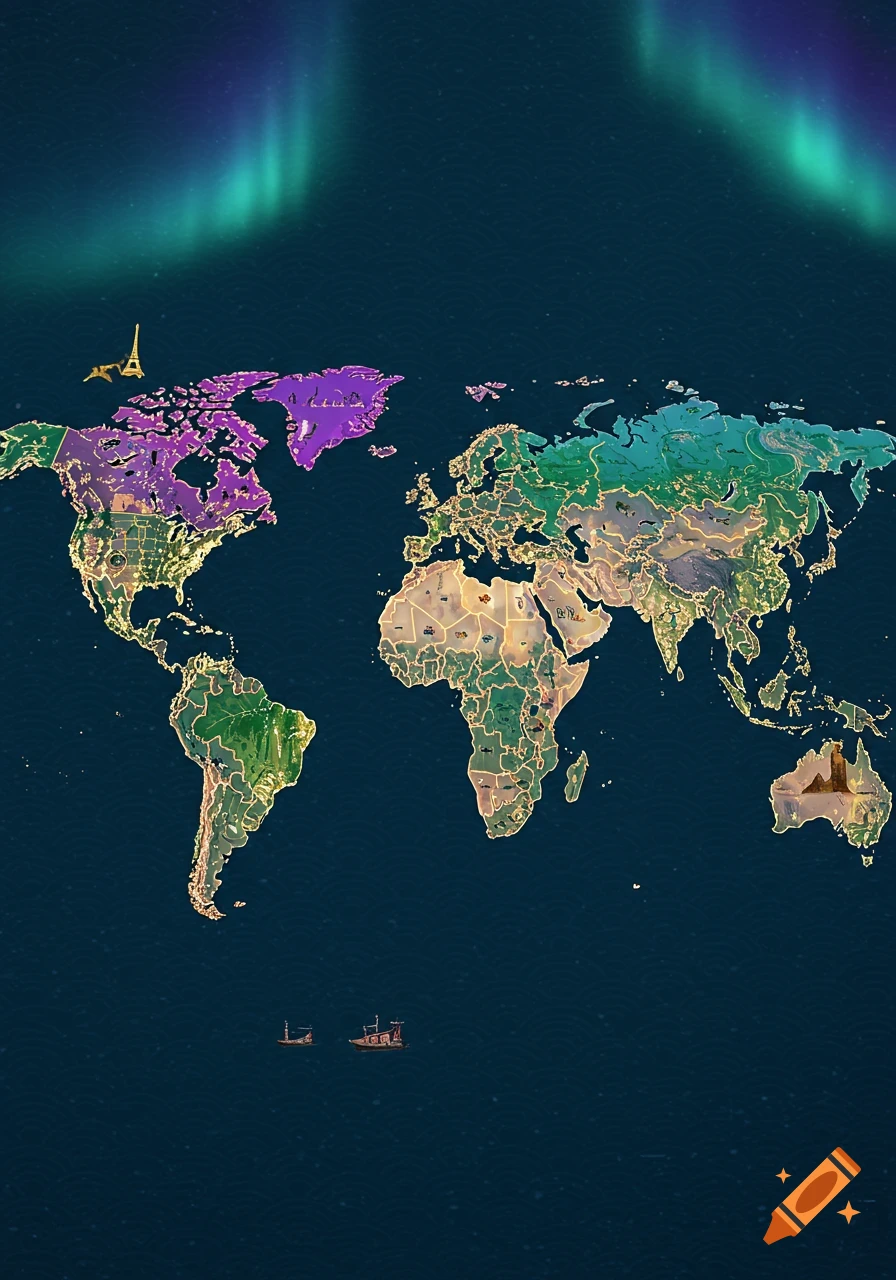
An infographic titled "Global Population Trends" with a globe at the center, surrounded by charts, graphs, and maps illustrating education, income, age, urban/rural distribution, migration, and regional overviews for North America, Africa, and Asia.

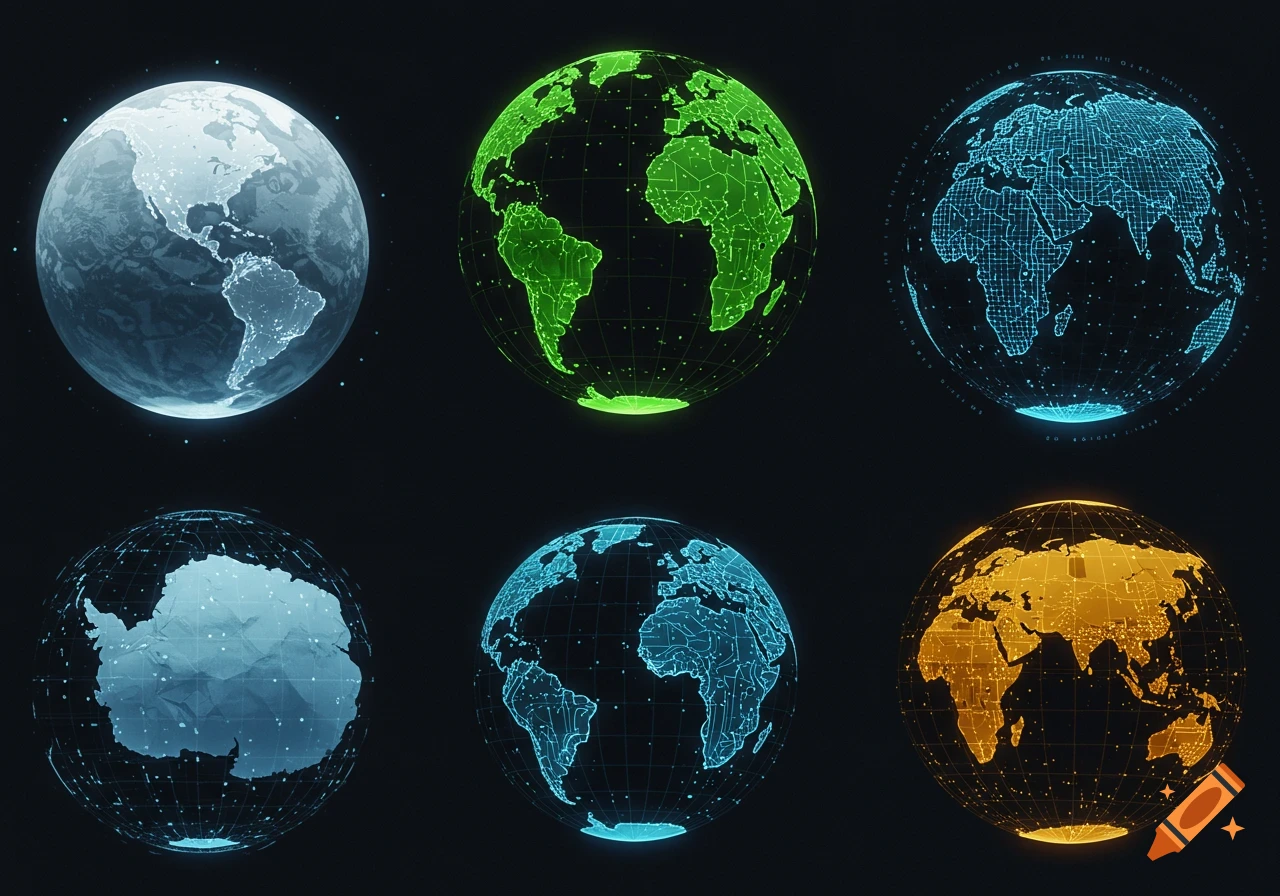
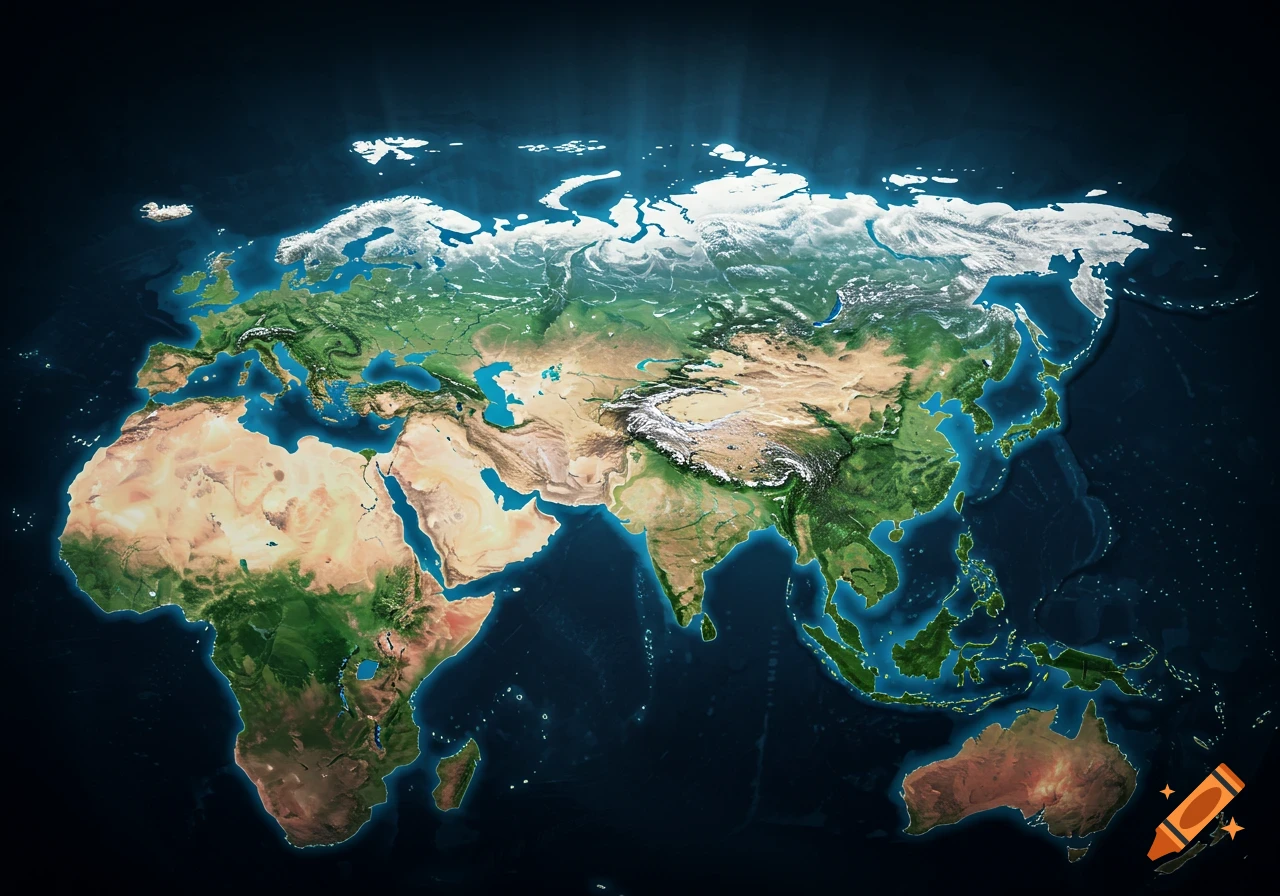
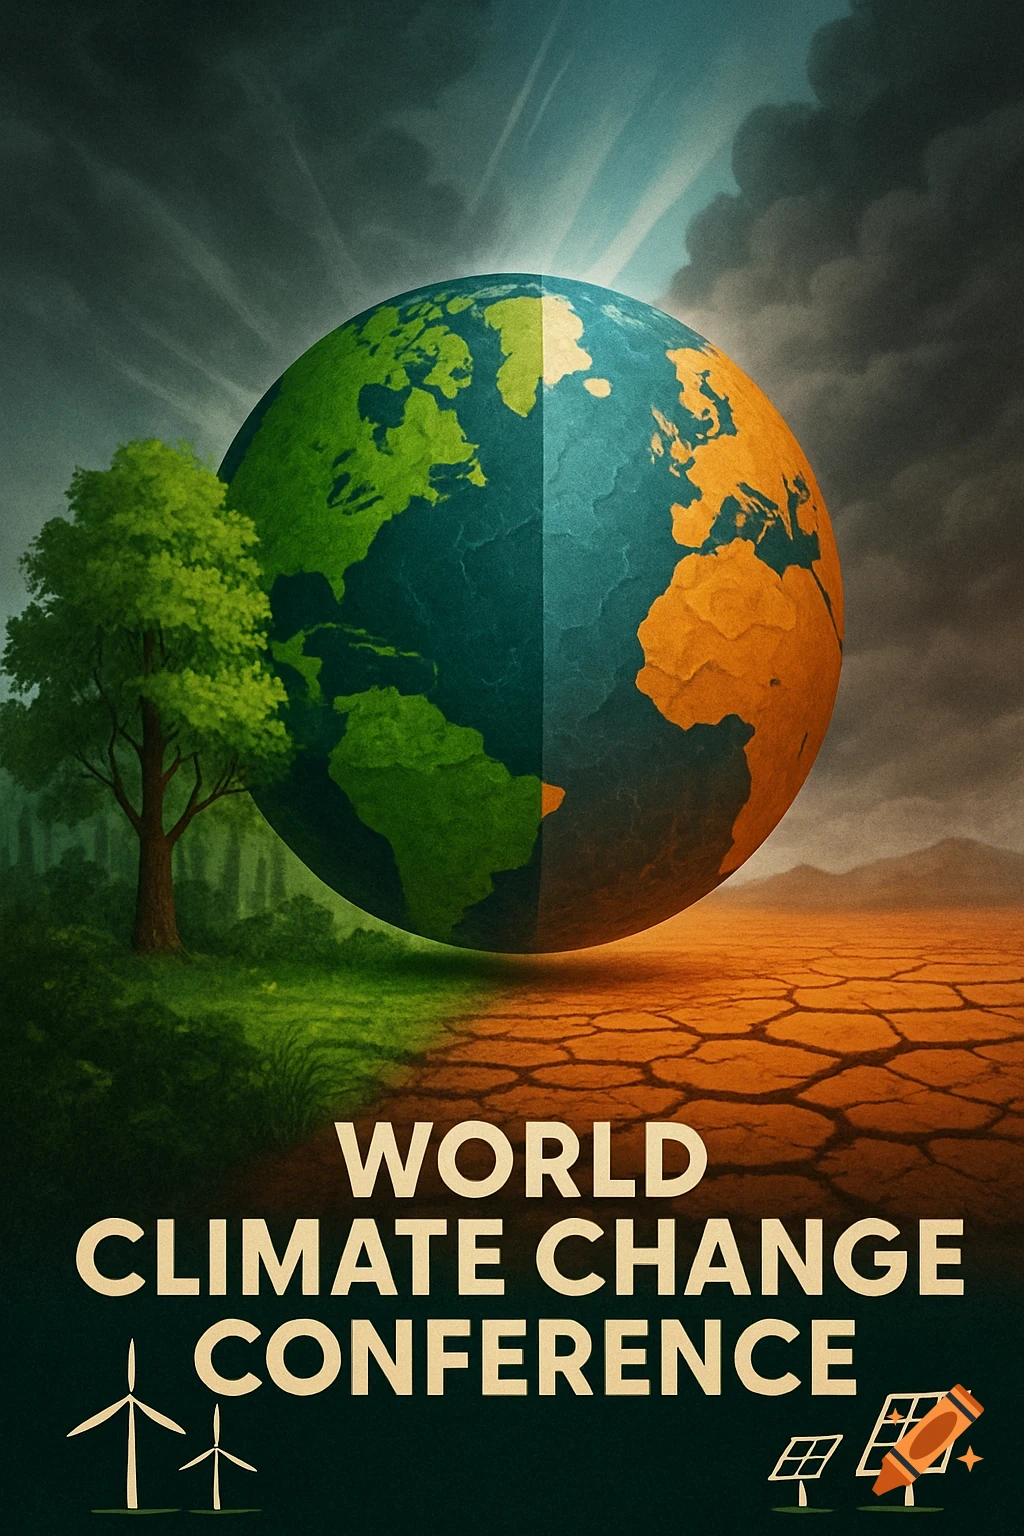
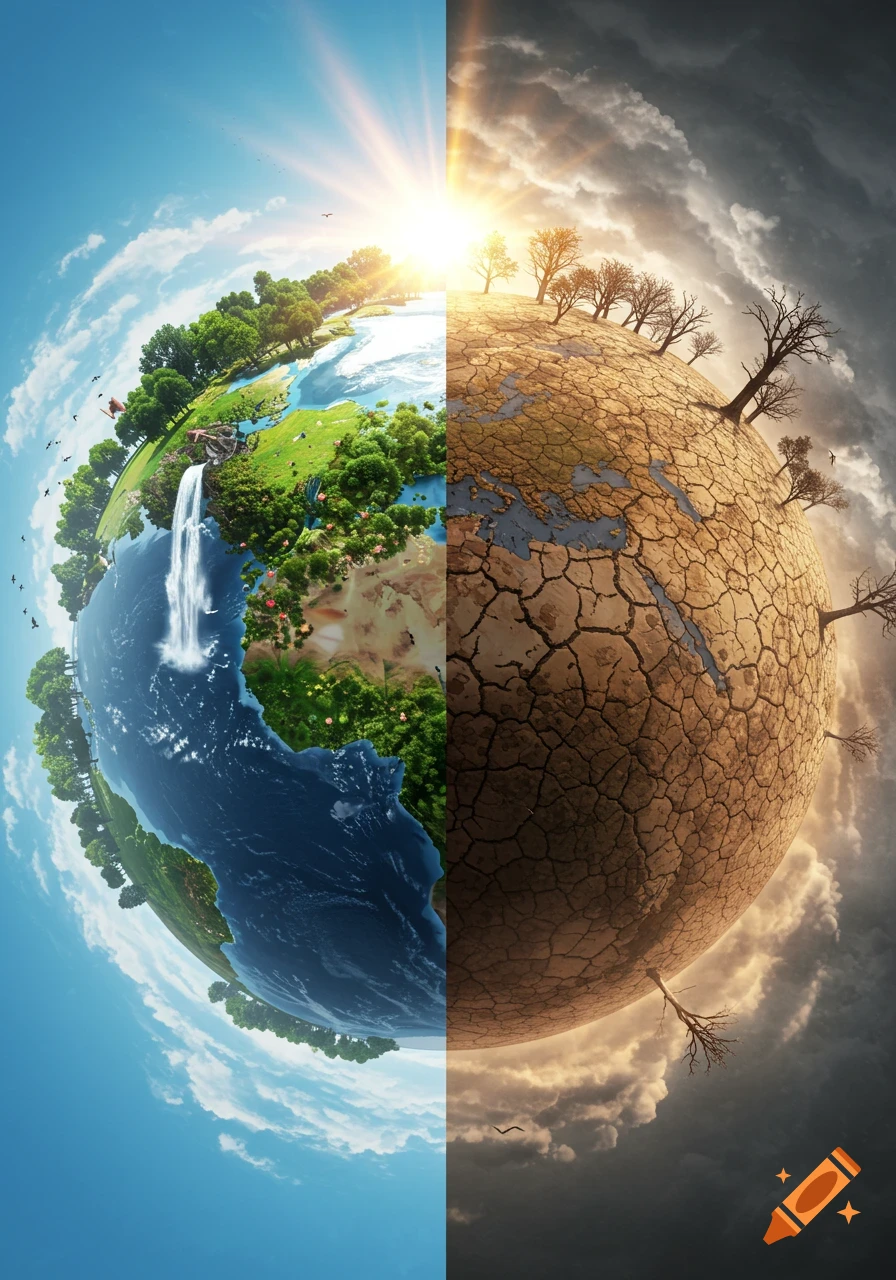
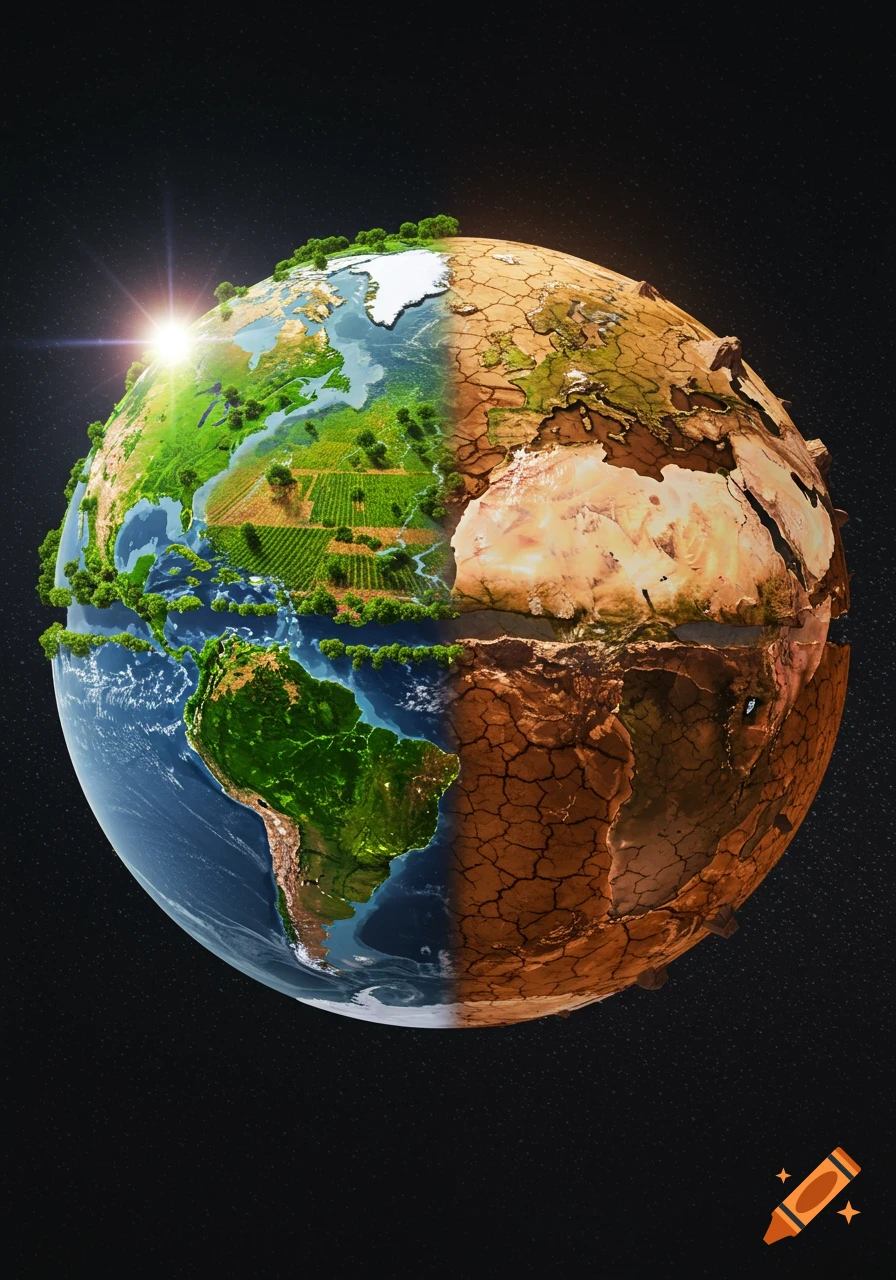
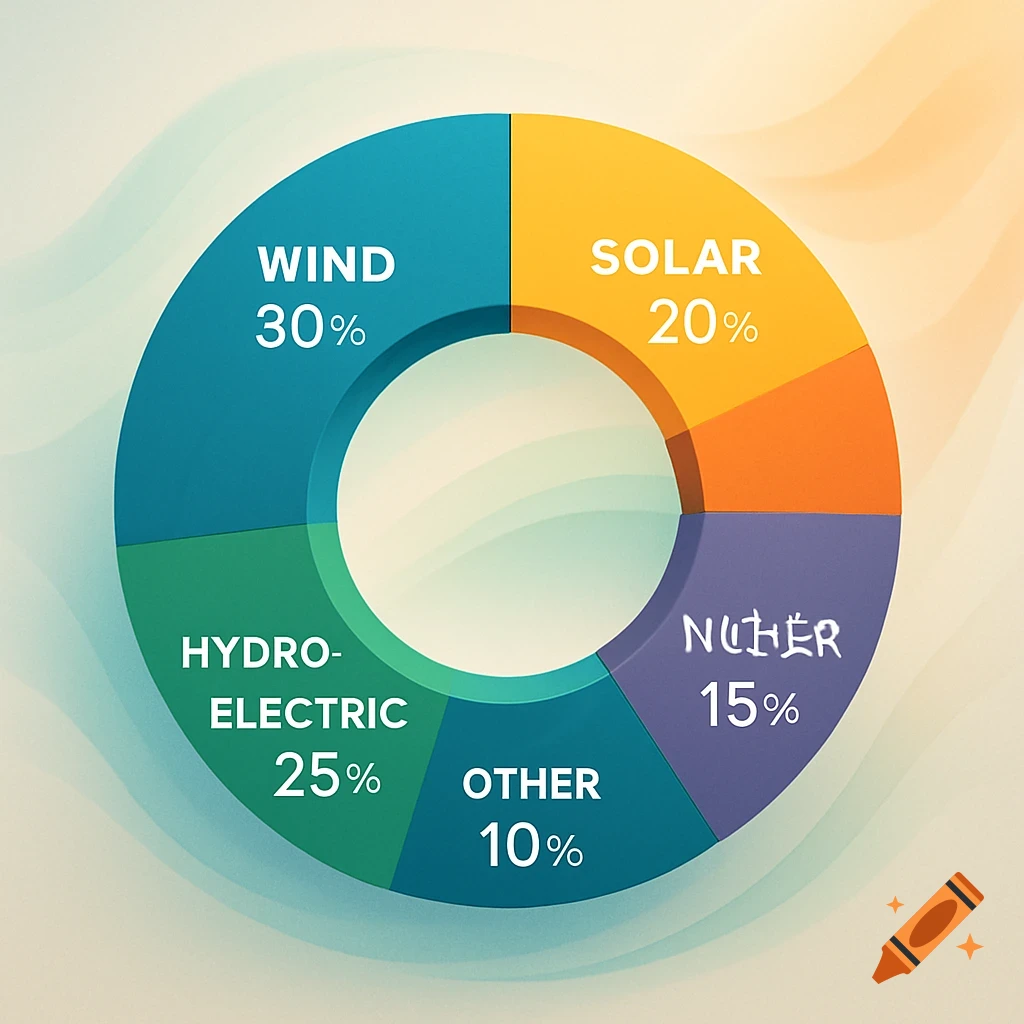
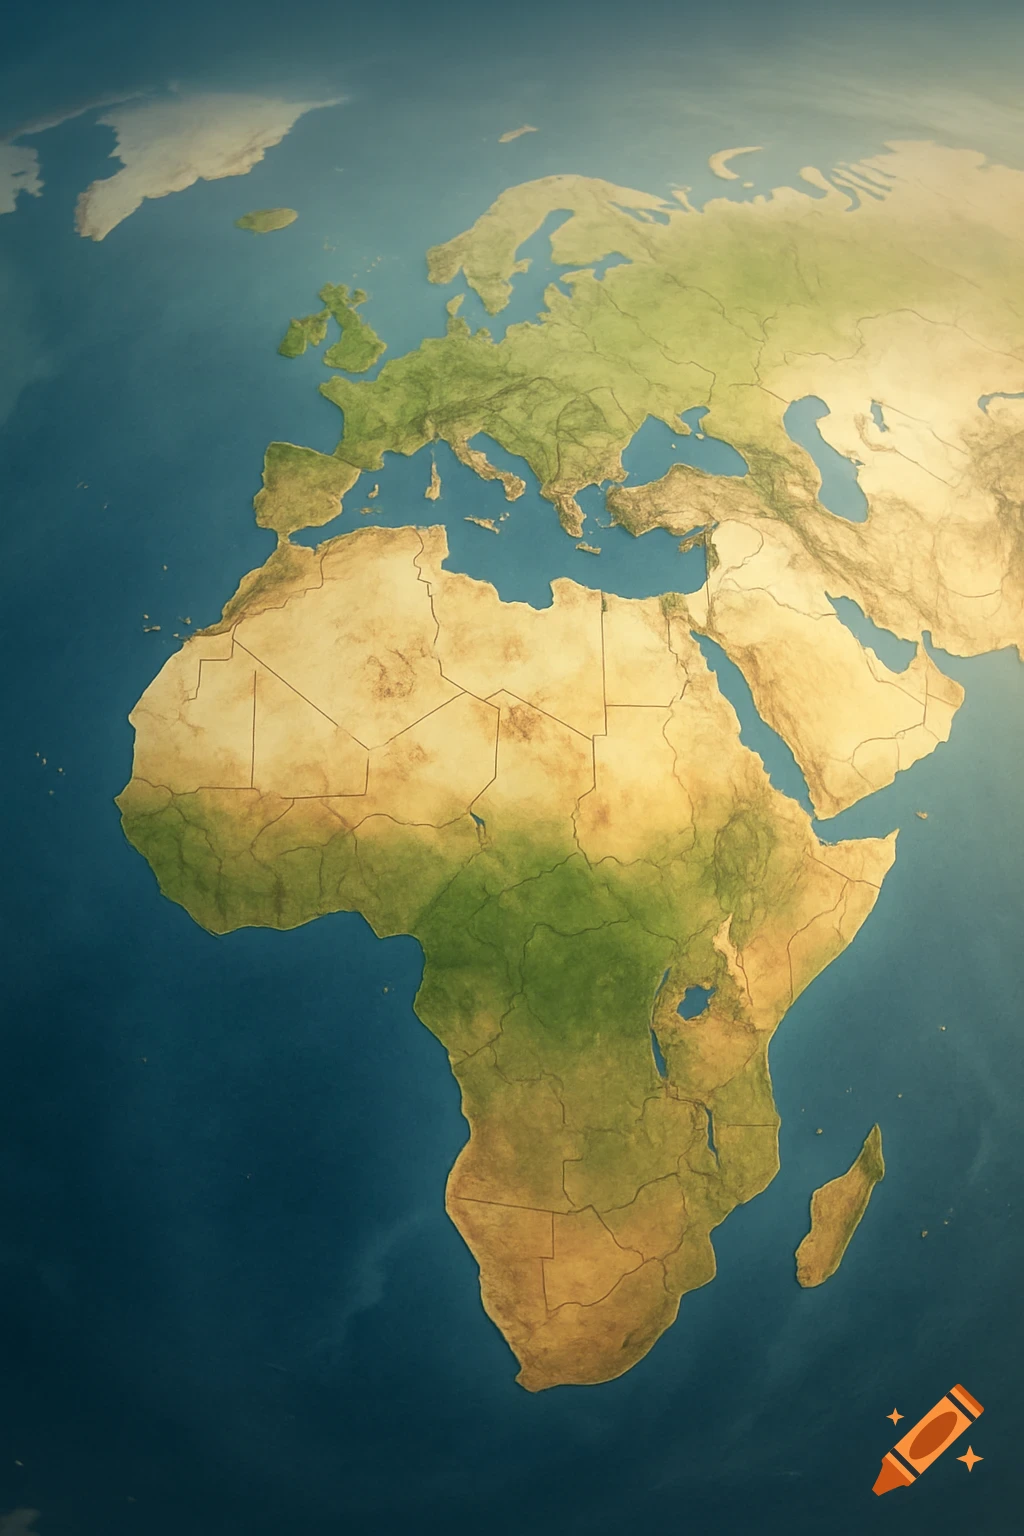
What characteristics of human populations interest you? Find several kinds of data on the topic of your choice to create an infographic. Infographics are visual representations of information, data, or knowledge meant to present complex information quickly and clearly. Infographics use many different strategies to present information, including graphs, charts, maps, diagrams, and pictures (and often a mixture of several of these). For example, if you were interested in how levels of education vary around the globe, you might locate statistics on percentages of people who complete high school and college on each continent or in rich countries vs. developing ones. Digitally or on paper, create an infographic that clearly shows the information. It must include a neatly organized, creatively designed visual of the topic you are sharing and at least 10 places/things/ideas, etc. shared Key features of an infographic Infographics combine visuals, data, and text to tell a complex and important story at a glance. They display information visually in a clear, structured and attention grabbing way. An effective infographic should have: A clear subject and story A unique, attention grabbing title A clear storyline with a clean and well-structured layout – a layout that supports people browsing the information or jumping to the information that interests them the most An engaging and visually-driven design ensuring the graphic is not too crowded and is eye-catching Text and images and Mehr sehen
More images like this