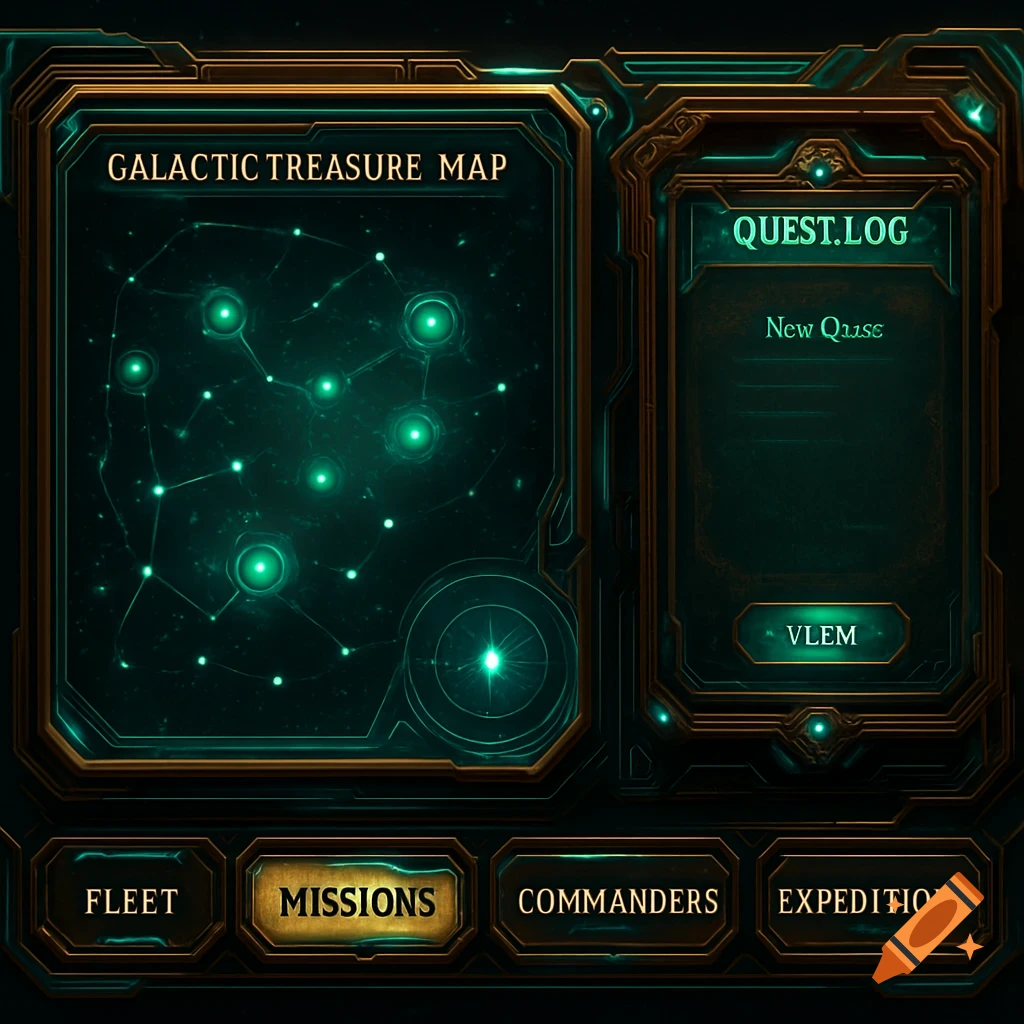
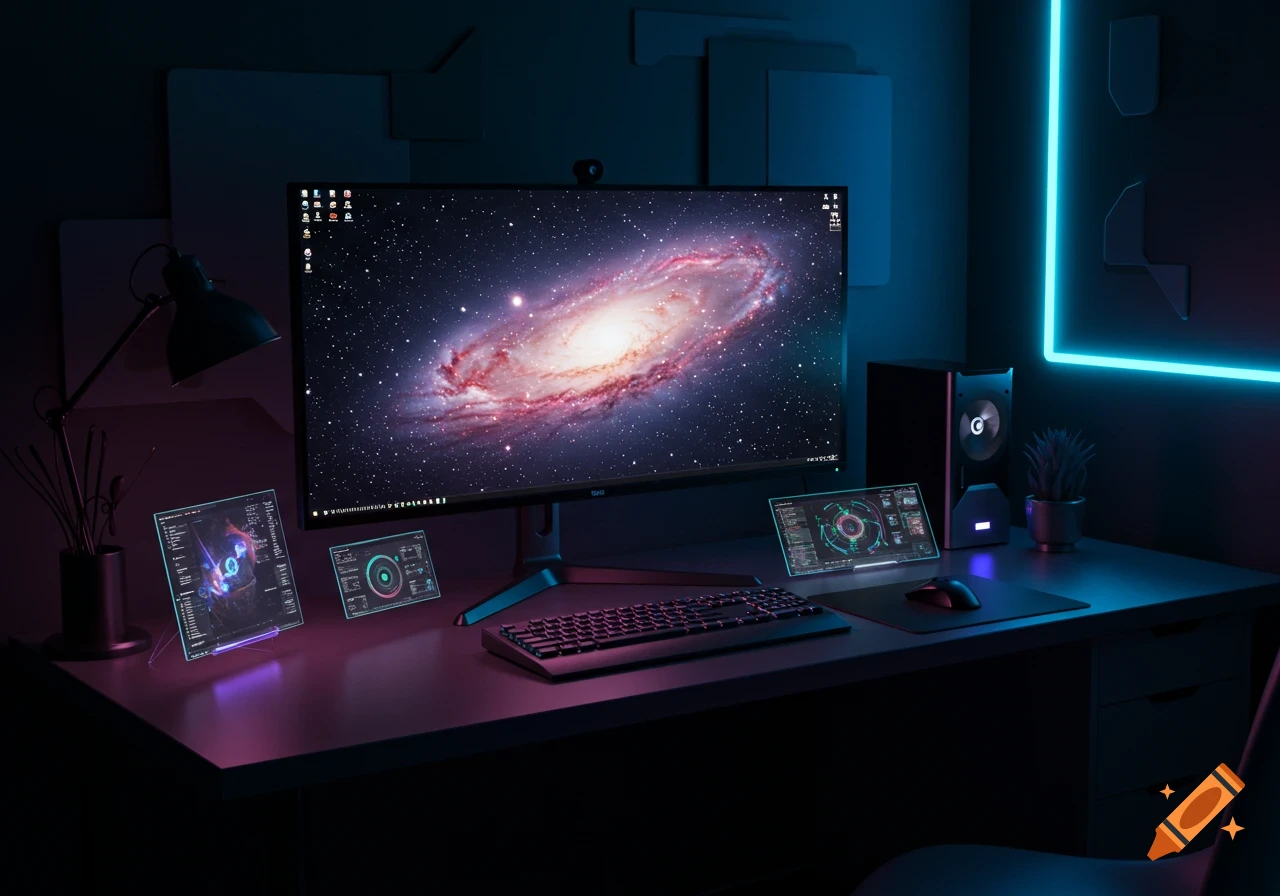
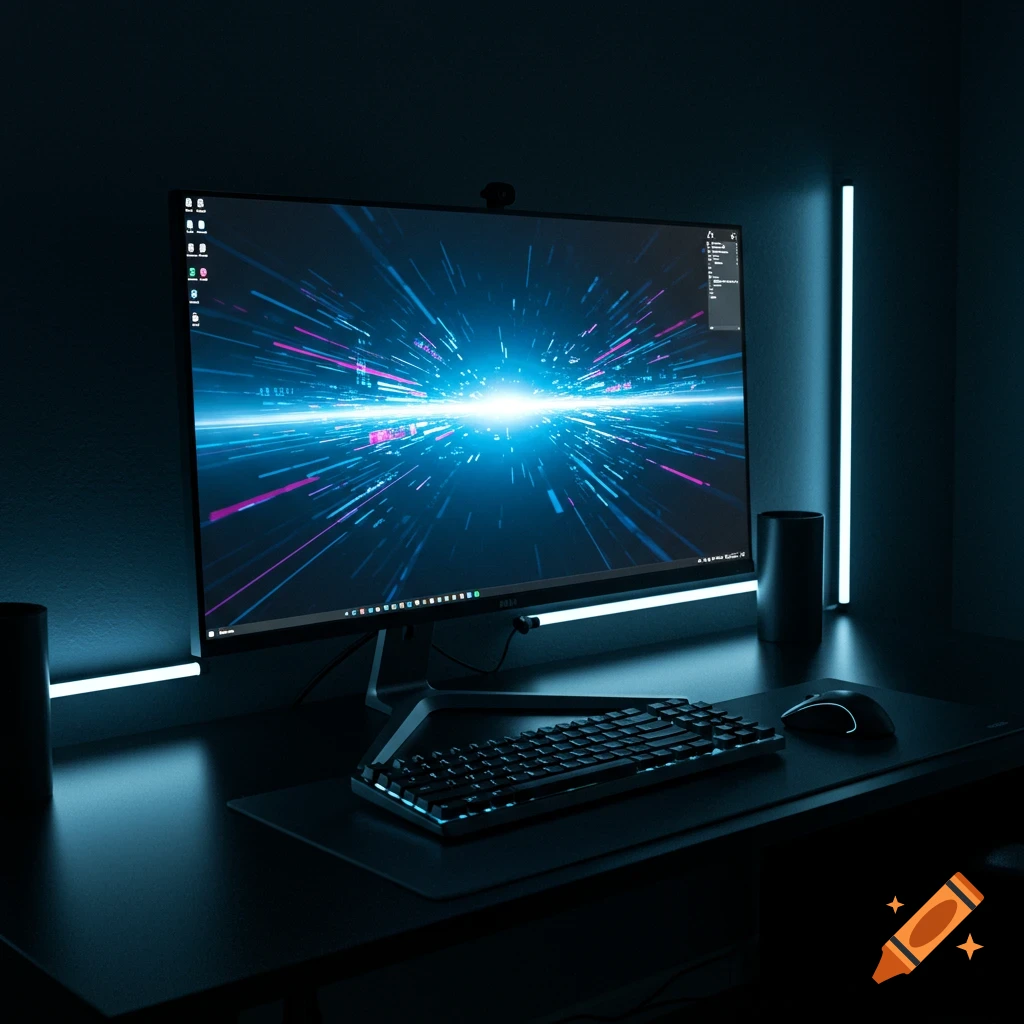
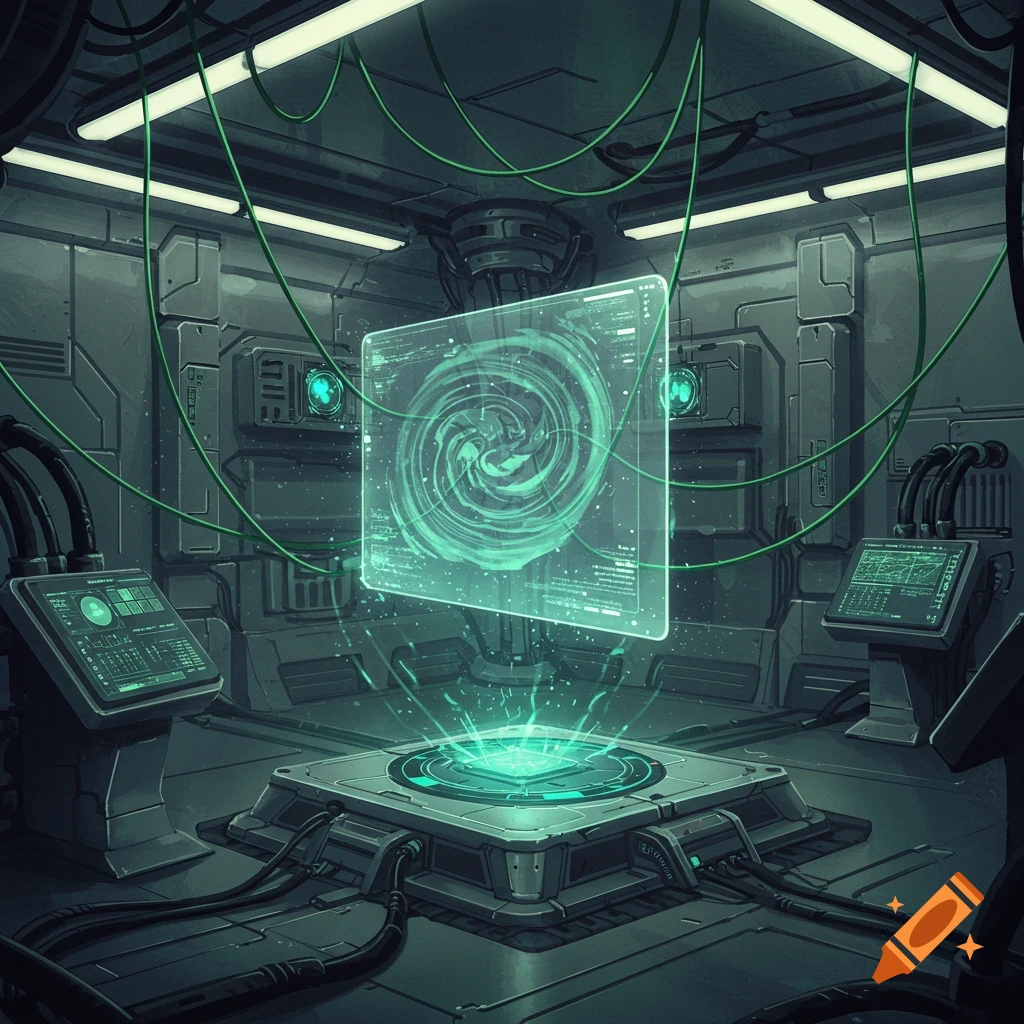
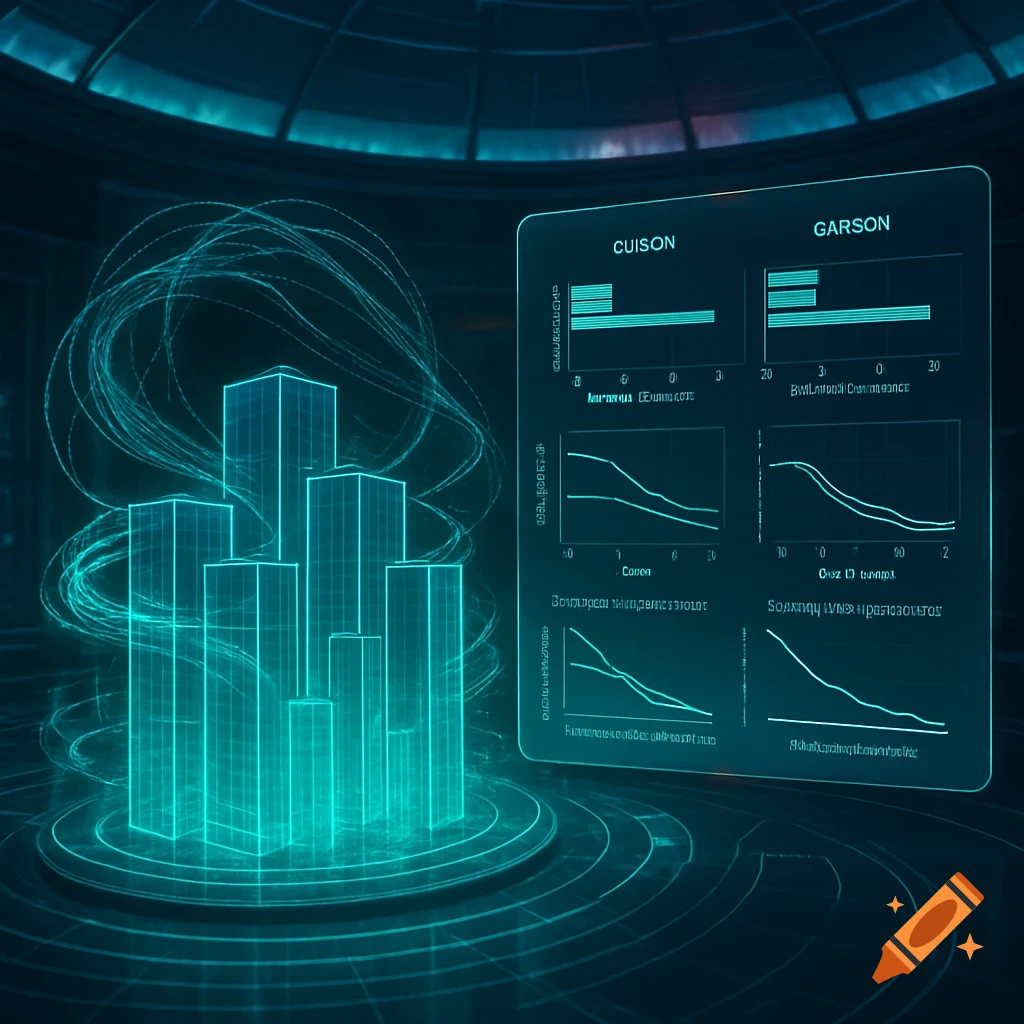
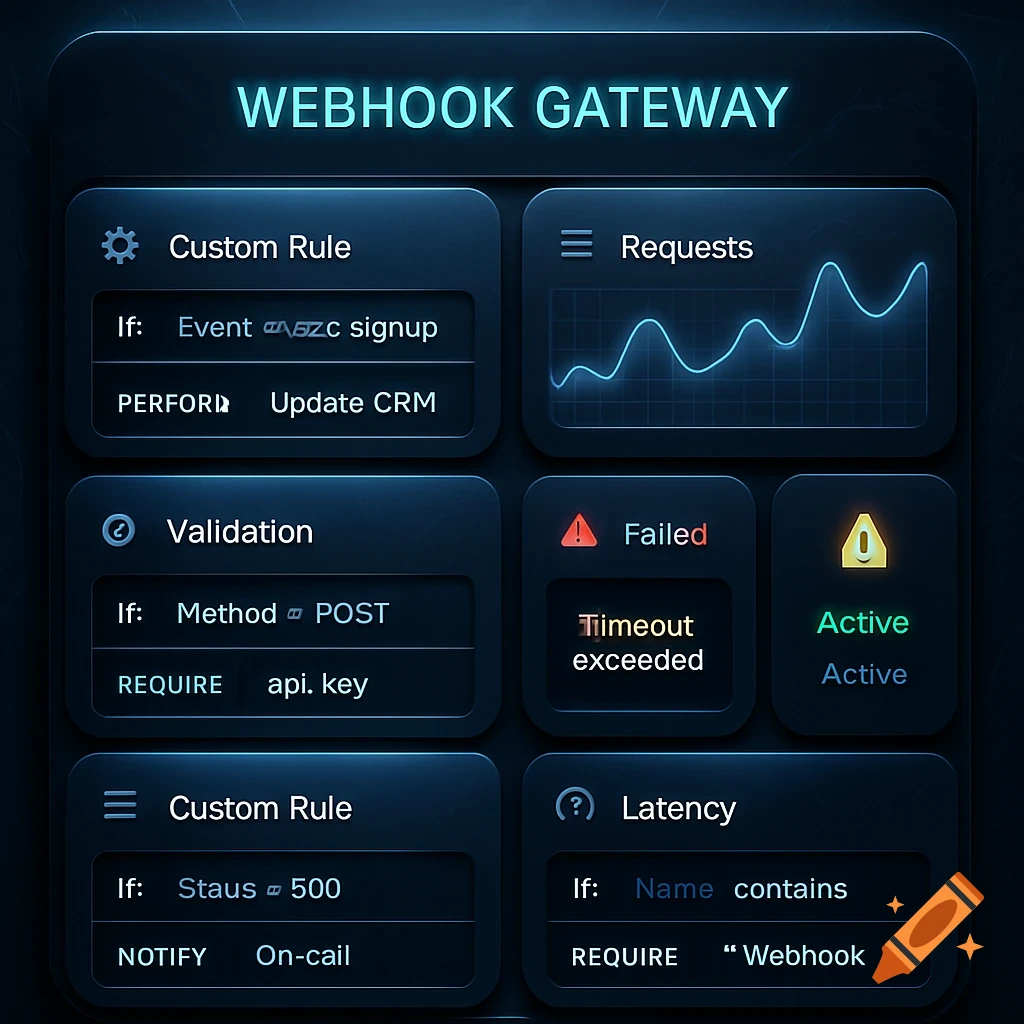
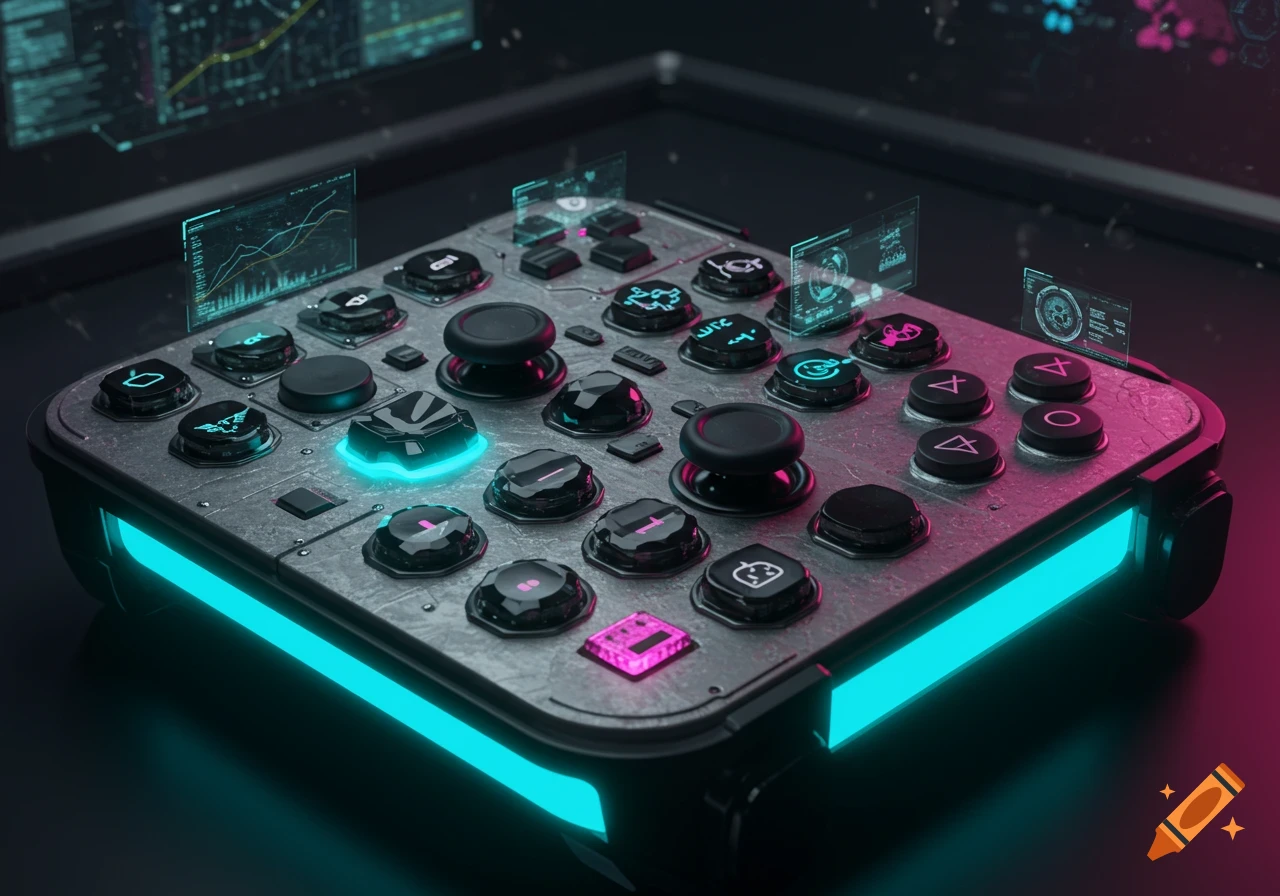
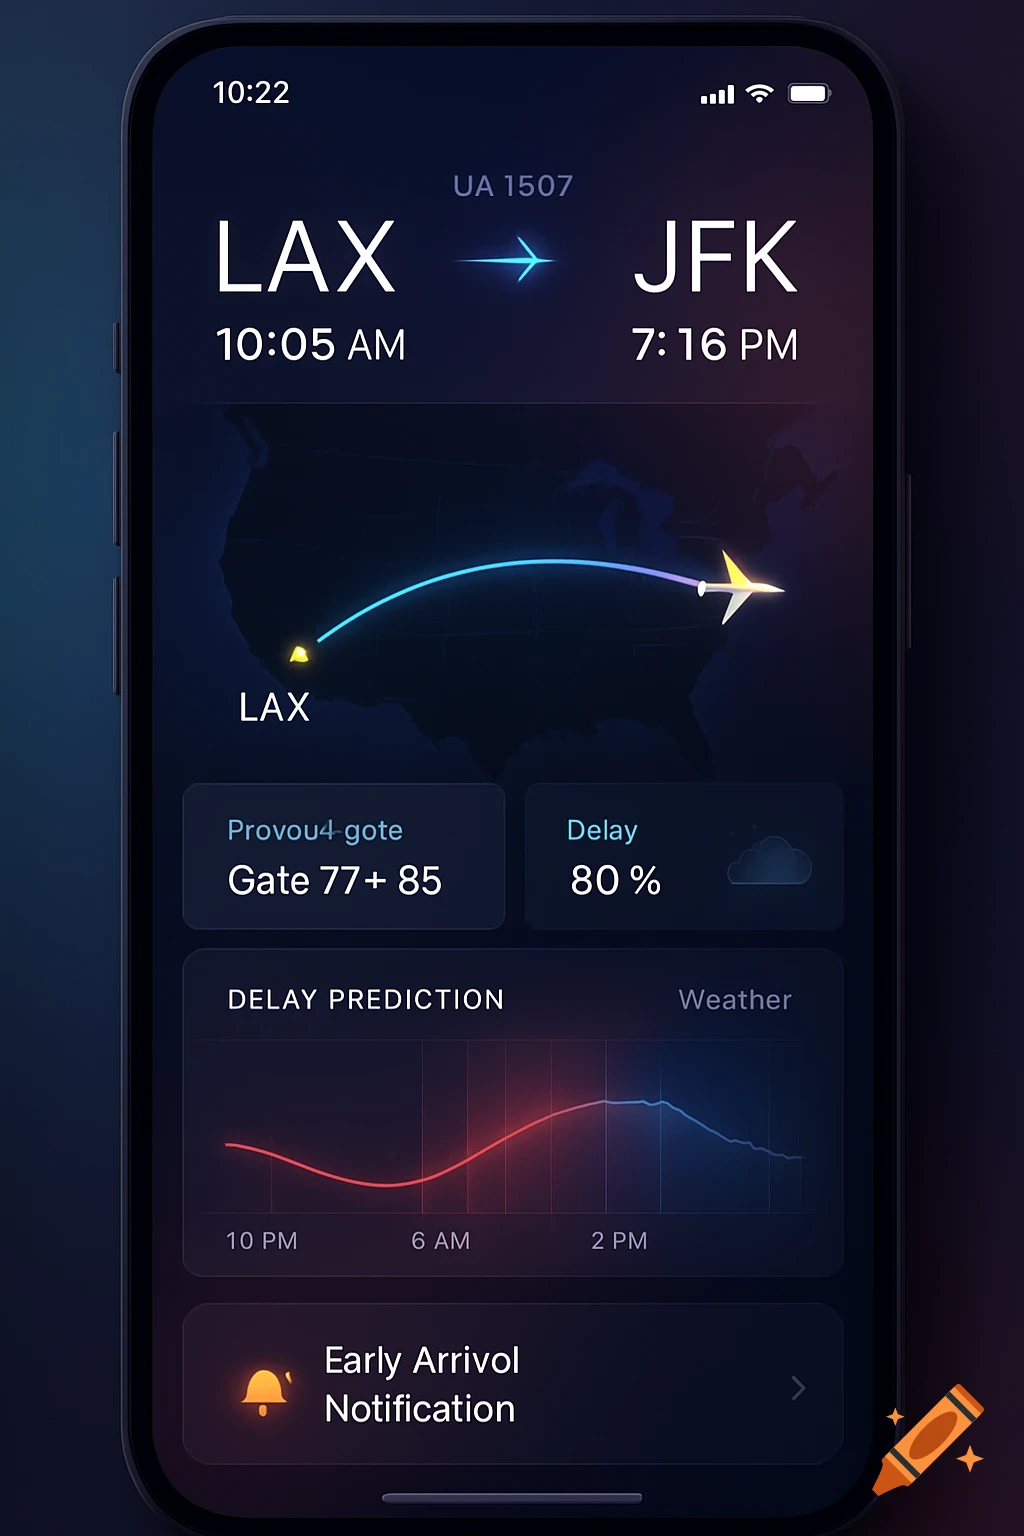
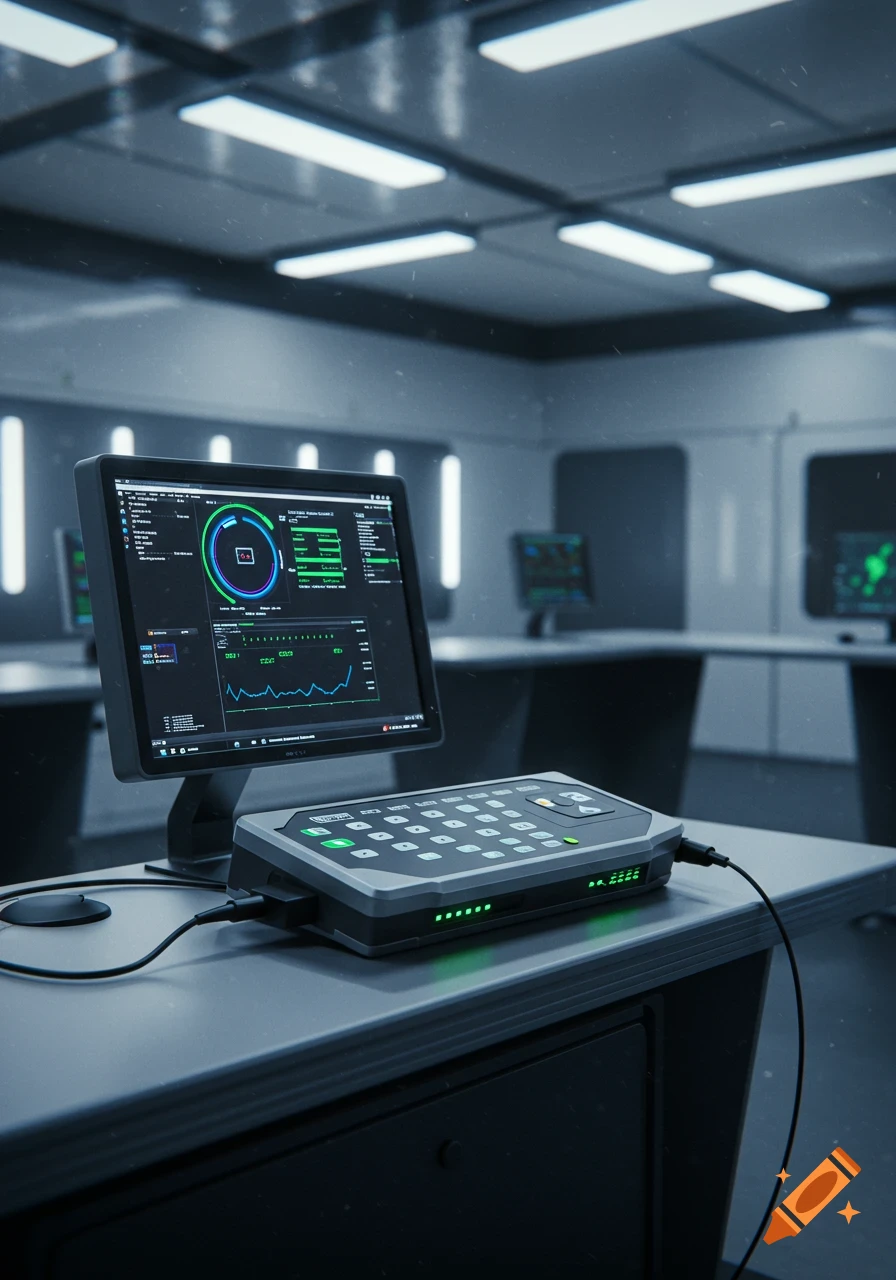
A dark scientific dashboard interface for a Cosmic Watch Muon Detector, showing controls, a live event monitor with a graph, and event data.

Create a picture as a mockup demonstrator for this interface: Dark scientific dashboard style “Cosmic Watch Muon Detector” title Connection/status bar START / RESET / REBOOT controls Threshold and detector name controls Live muon rate plot ADC spectrum histogram Event counter and last event data Pico 2 / USB serial detector theme Clean PyQt6 application look extra features: 🌌 Muon rate counter (events/sec) 📈 Live rate graph 📊 ADC energy spectrum 💾 Start/stop measurement logging 🕒 Measurement duration timer 📁 Save CSV: timestamp,adc,count,threshold 12345,734,10,500 Detector health: Pico connected Last packet time Event timeout warning data: timeAtEvent adcAtEvent eventCount Threshold and commands: START RESET REBOOT PING THRESHOLD:<value> NAME:<text> a good layout would be: +-----------------------------------------------------------+ | Cosmic Watch Muon Detector | | Device: Pico 2 Status: Connected | +-----------------------------------------------------------+ +----------------------+ +-------------------------------+ | Detector Control | | Live Event Monitor | | | | | | [START] [RESET] | | Event rate: 12.4 Hz | | [REBOOT] | | Events: 15420 | | | | | | Threshold: | | +-------------------------+ | | [====500====] [SET] | | | | | | | | | Rate vs Time Plot | | | Name: | | | | | | [CosmicWatch____] | | +-------------------------+ | | [SET NAME] | | | +----------------------+ +-------------------------------+ +-----------------------------------------------------------+ | Mehr sehen
More images like this