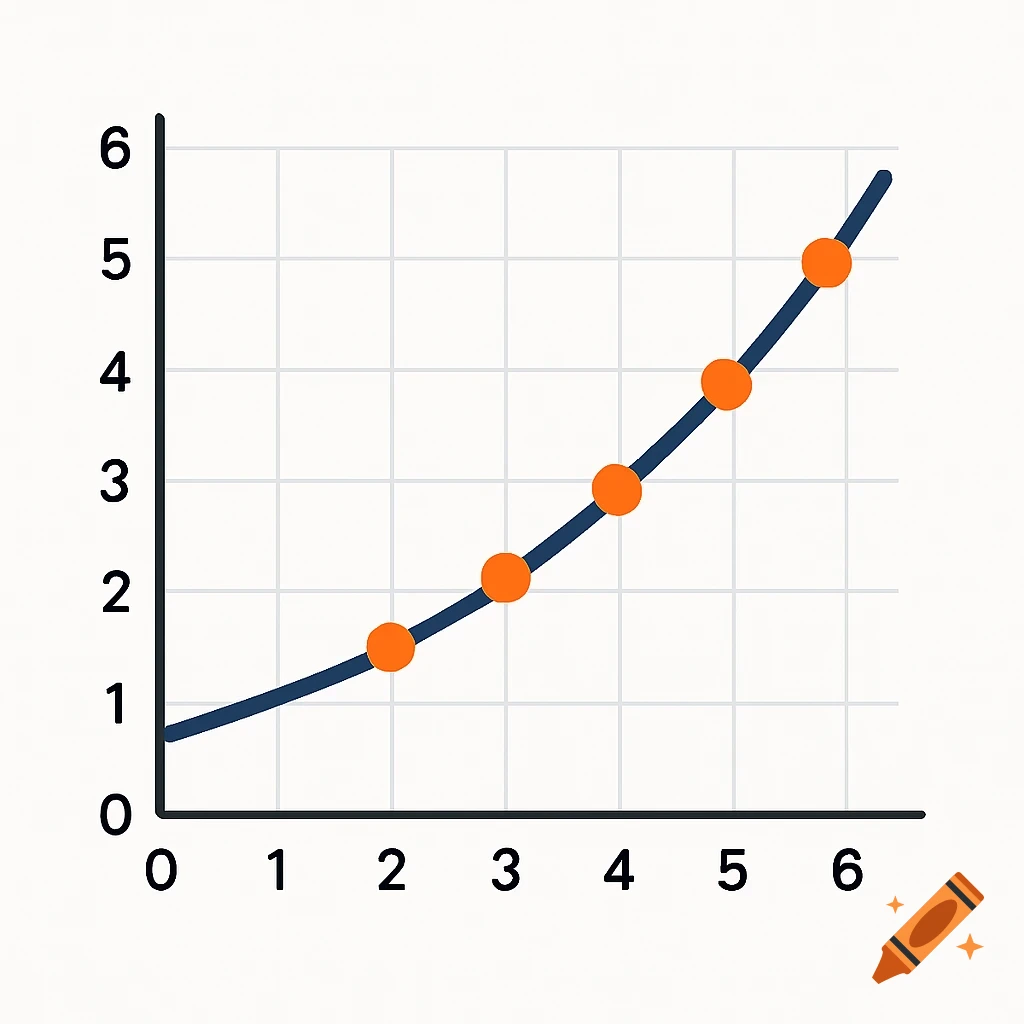
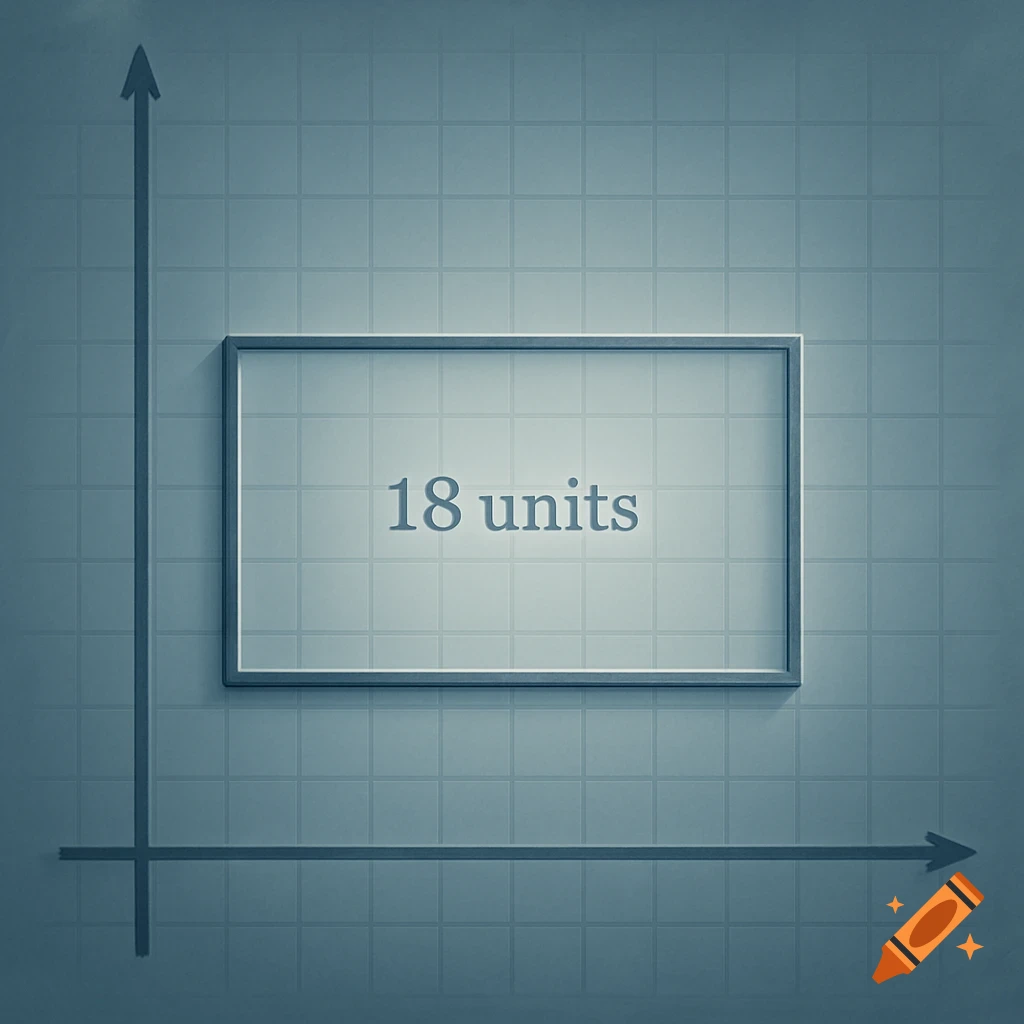
A graph illustrating an increase in demand, showing two demand curves labeled D1 and D2.
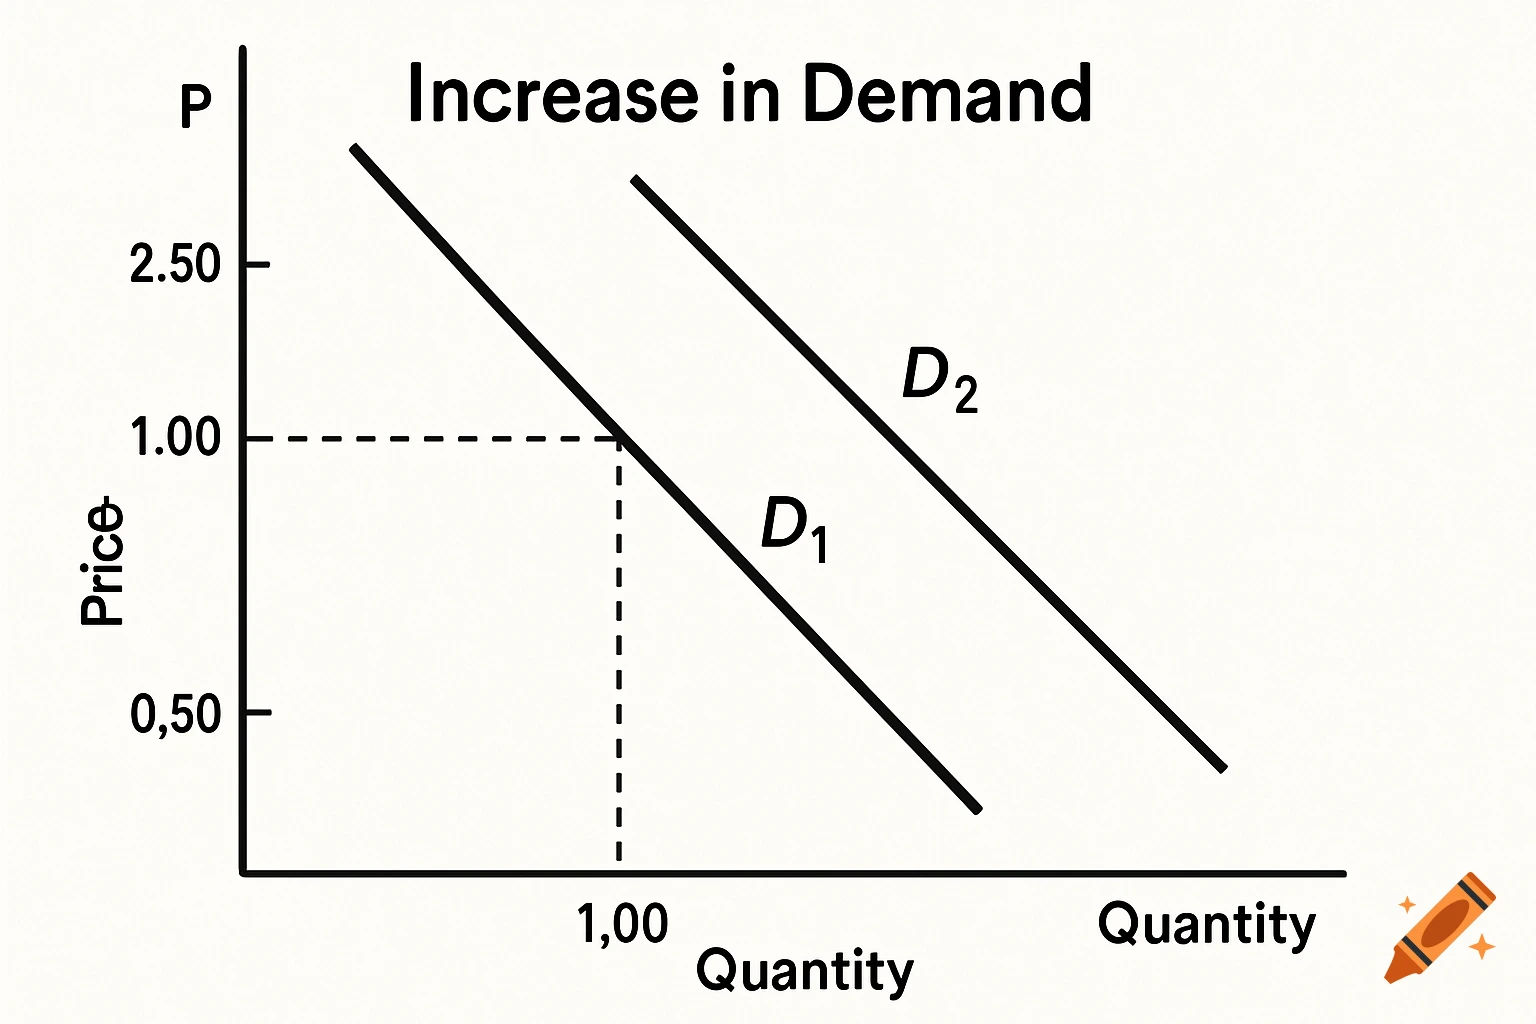
Plot the original demand curve (D1) at various price points to represent the initial demand. Then, plot the new curve (D2) to show the increase in demand at the same price point of $1.00. Mehr sehen
More images like this