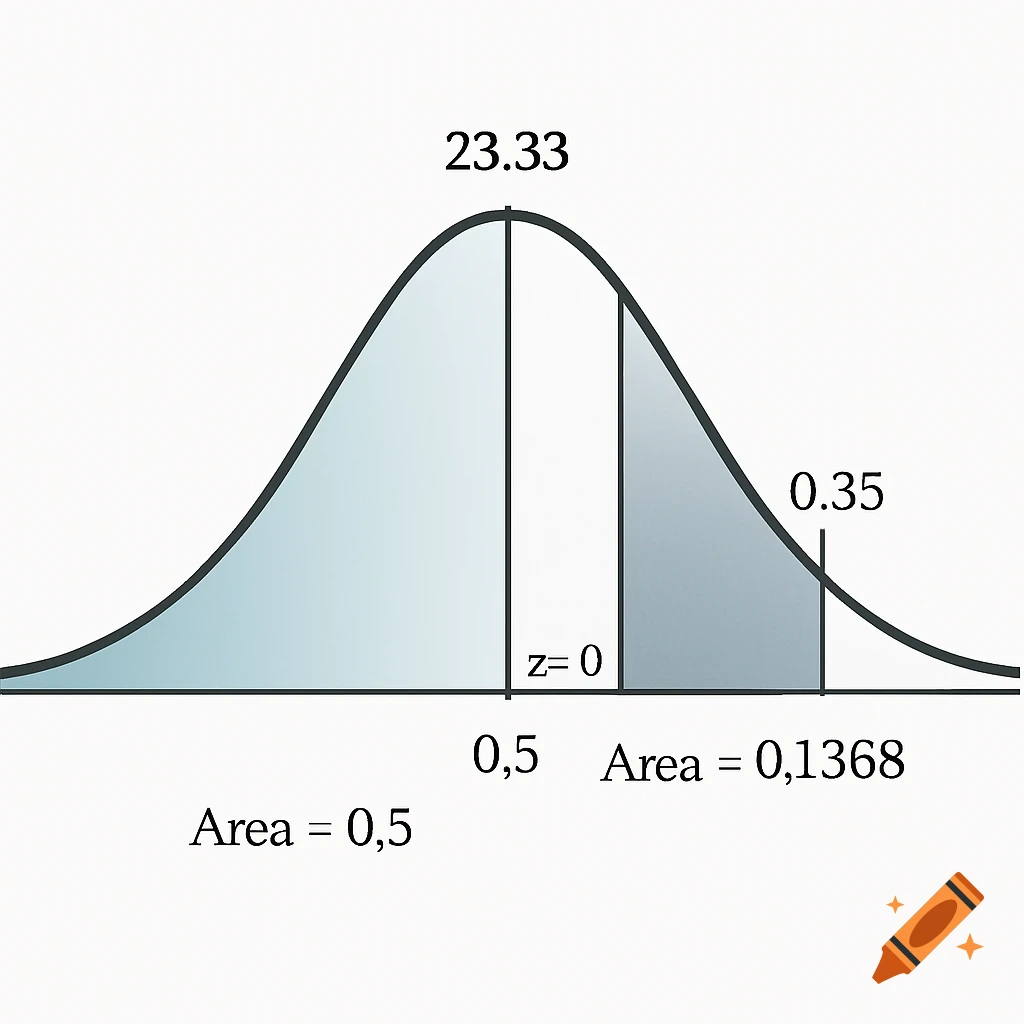
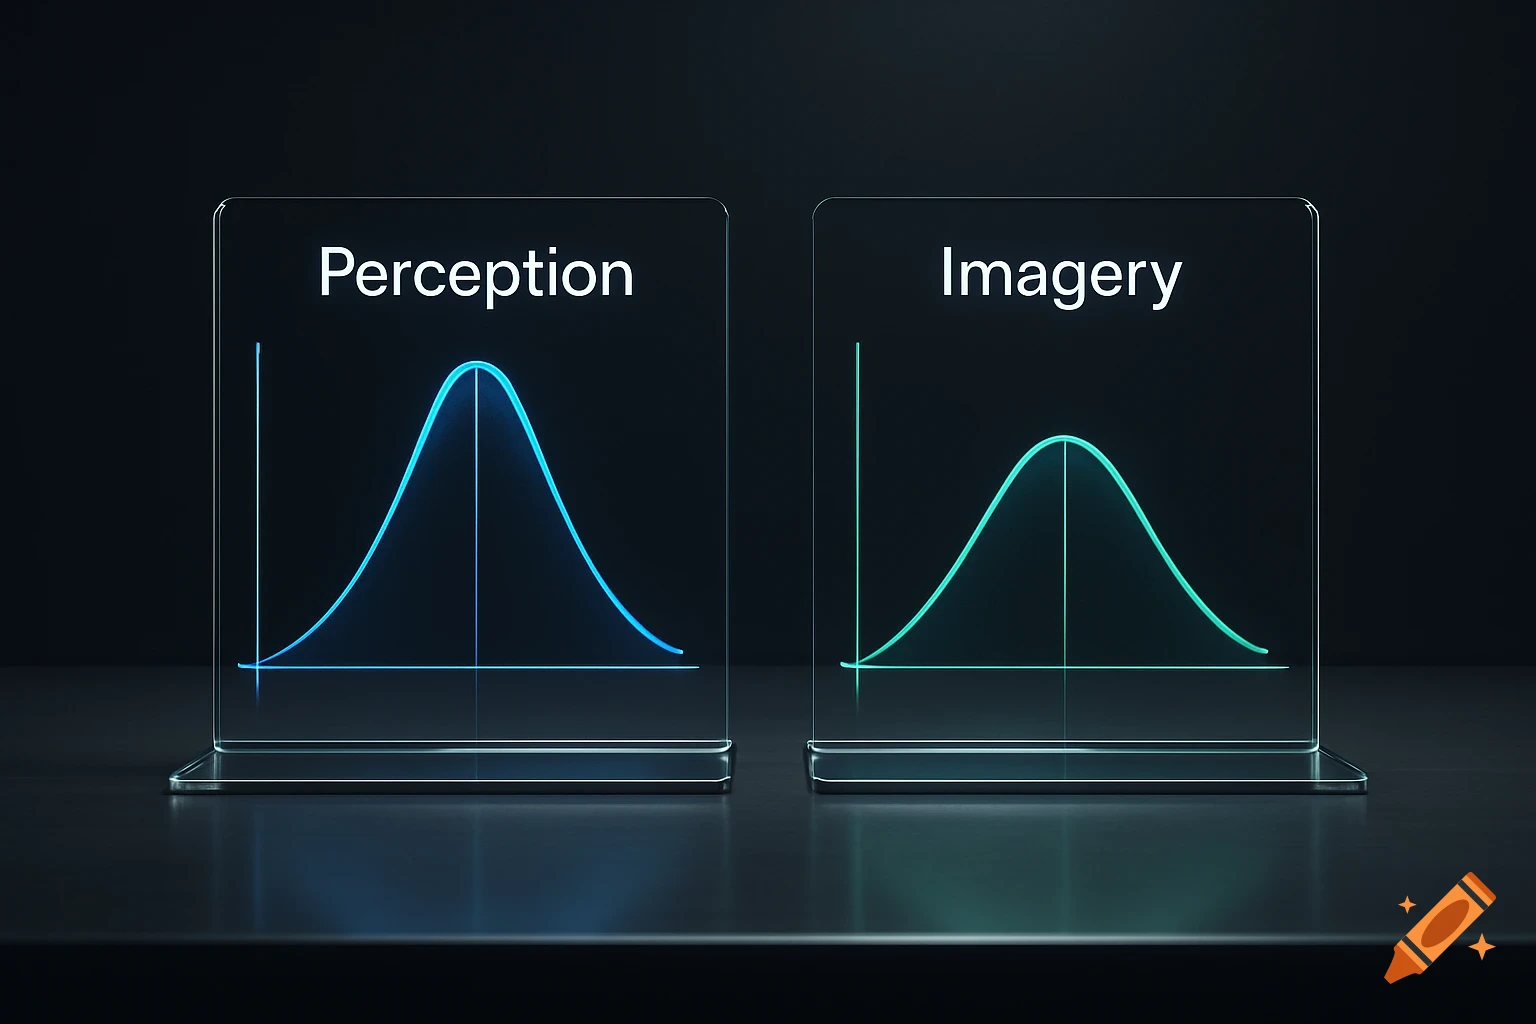
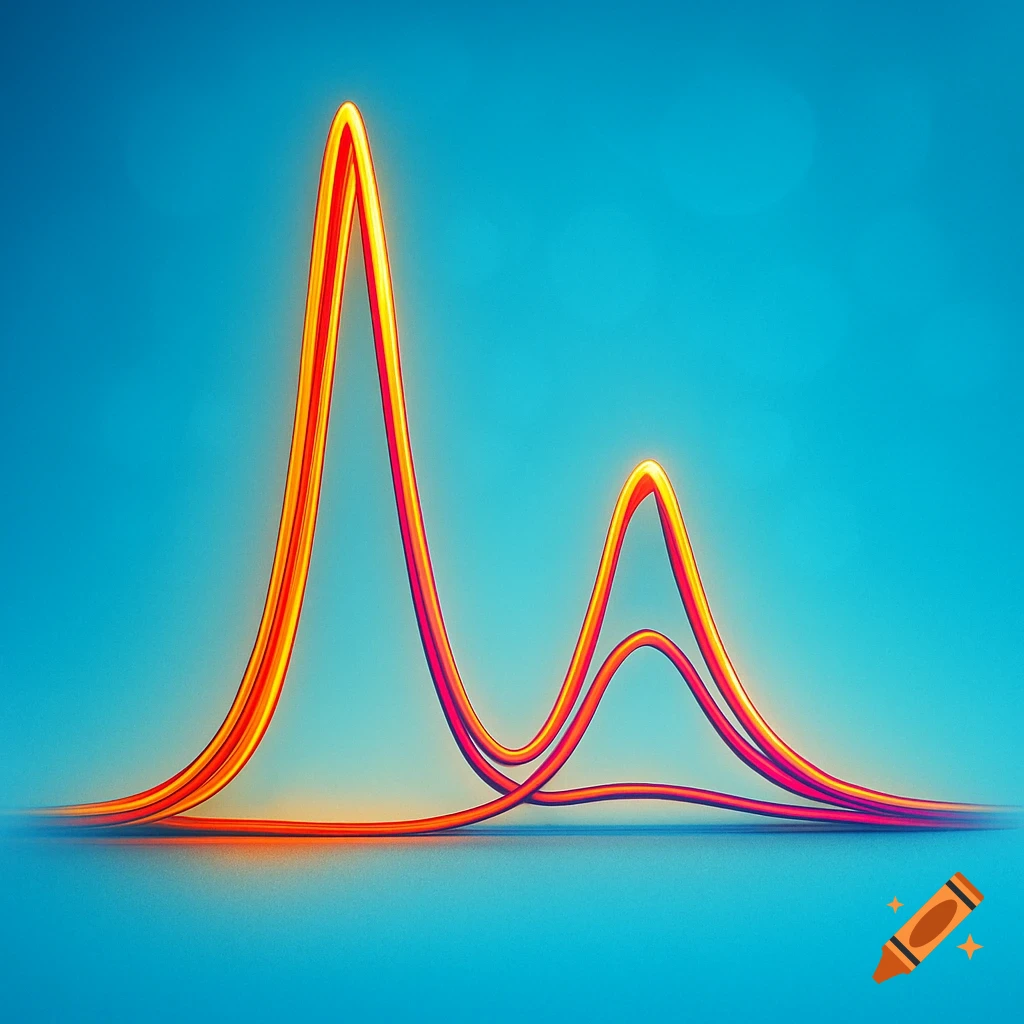
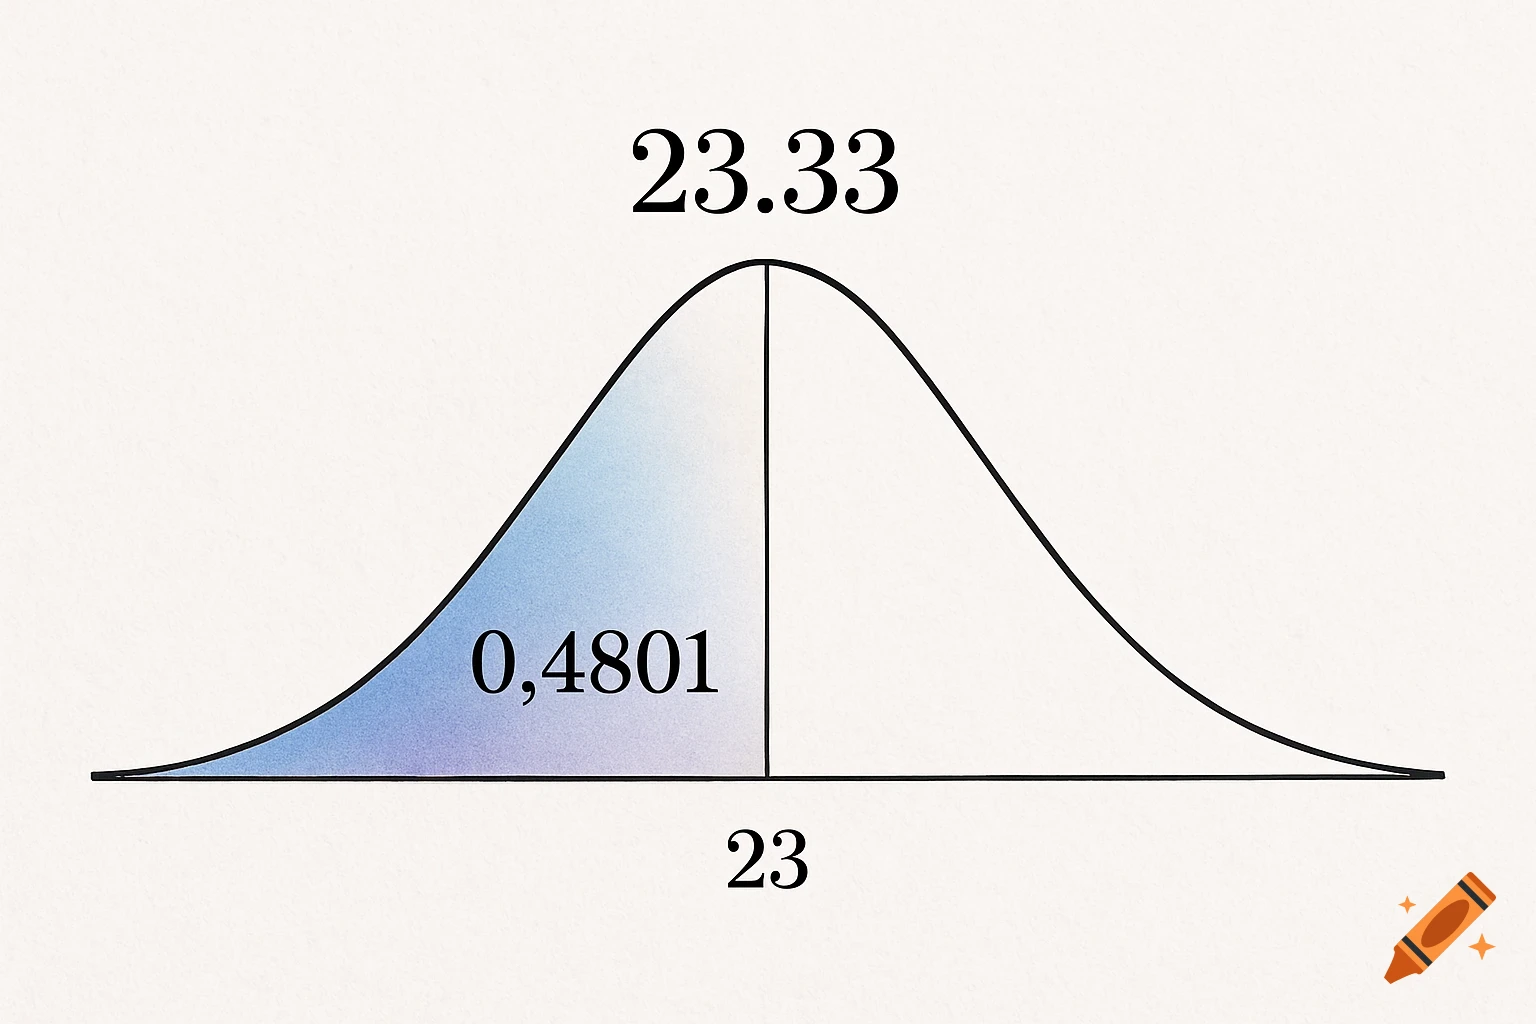
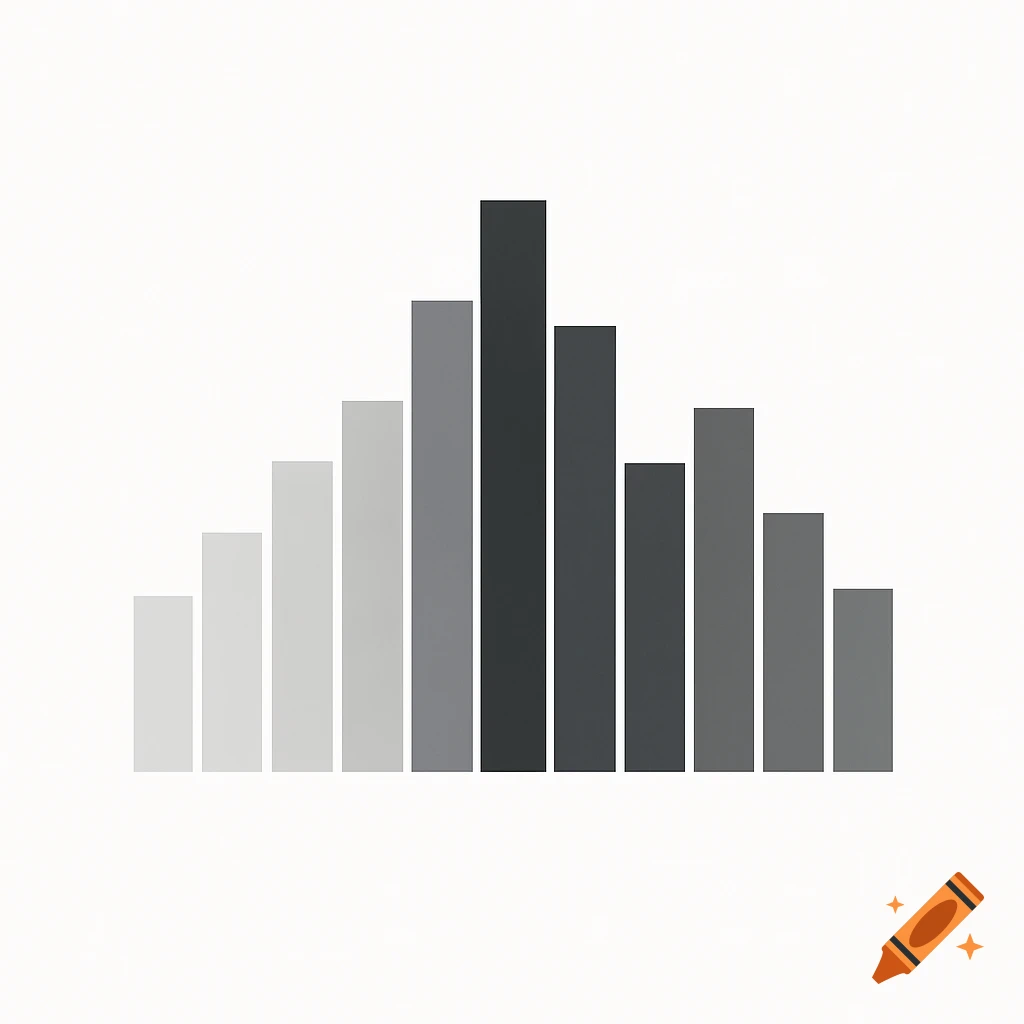
A bell curve graph showing the 68% confidence interval.

Graph Description: • A symmetrical curve with a high middle. • Lines drawn one standard deviation away from the center on both sides. • The area under the curve between those lines represents about 68% of the data. Mehr sehen
More images like this